Now trading at a price of $50.96, Realty has moved 1.5% so far today.
Realty returned losses of -10.0% last year, with its stock price reaching a high of $68.85 and a low of $48.42. Over the same period, the stock underperformed the S&P 500 index by -33.0%. As of April 2023, the company's 50-day average price was $54.89. Realty Income, The Monthly Dividend Company, is an S&P 500 company and member of the S&P 500 Dividend Aristocrats index. Based in San Diego, CA, the large-cap Real Estate company has 391 full time employees. Realty has offered a 6.0% dividend yield over the last 12 months.
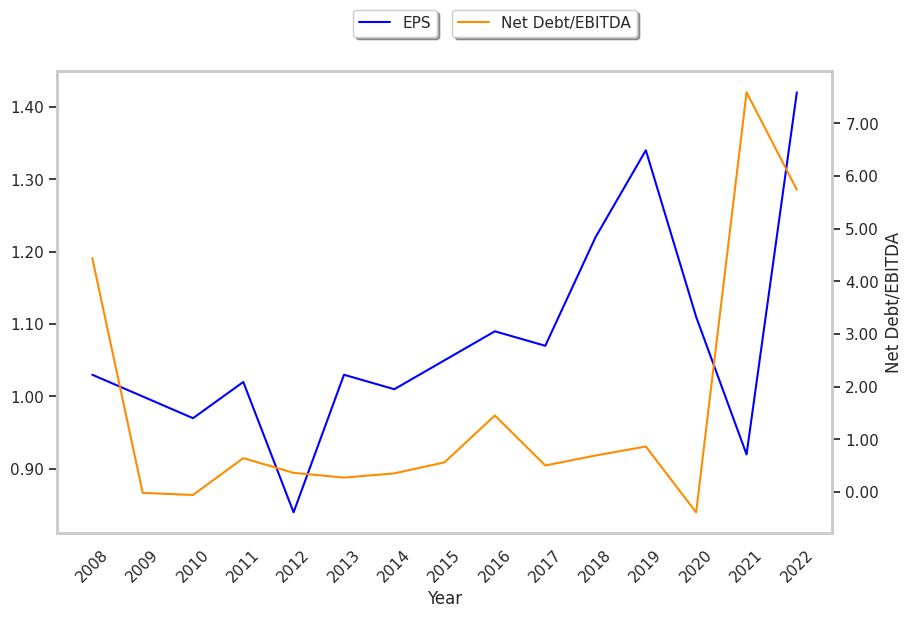
Exceptional Profitability Overshadowed by Excessive Leverage:
| 2018-02-22 | 2019-03-01 | 2020-02-24 | 2021-02-23 | 2022-02-23 | 2023-02-22 | |
|---|---|---|---|---|---|---|
| Revenue (MM) | $1,216 | $1,328 | $1,488 | $1,647 | $2,080 | $3,344 |
| Operating Margins | 48% | 48% | 50% | 48% | 46% | 39% |
| Net Margins | 26.0% | 27.0% | 28.0% | 24.0% | 17.0% | 26.0% |
| Net Income (MM) | $319 | $364 | $436 | $395 | $359 | $869 |
| Net Interest Expense (MM) | -$247 | -$266 | -$291 | -$309 | -$324 | -$465 |
| Depreciation & Amort. (MM) | -$499 | -$540 | -$594 | -$677 | -$898 | -$1,670 |
| Earnings Per Share | $1.07 | $1.22 | $1.34 | $1.11 | $0.92 | $1.42 |
| EPS Growth | n/a | 14.02% | 9.84% | -17.16% | -17.12% | 54.35% |
| Diluted Shares (MM) | 283 | 299 | 326 | 356 | 392 | 612 |
| Free Cash Flow (MM) | $2,289 | $2,710 | $960 | $856 | $1,072 | $2,128 |
| Capital Expenditures (MM) | -$1,413 | -$1,769 | $109 | $259 | $251 | $436 |
| Net Current Assets (MM) | -$6,534 | -$6,968 | -$8,418 | -$8,593 | -$17,292 | -$20,061 |
| Long Term Debt (MM) | $445 | $569 | $499 | $249 | $12,749 | $14,528 |
| Net Debt / EBITDA | 0.5 | 0.69 | 0.86 | -0.39 | 7.59 | 5.74 |
A Lower P/B Ratio Than Its Sector Average but Trades Above Its Graham Number:
Realty has a trailing twelve month P/E ratio of 41.0, compared to an average of 24.81 for the Real Estate sector. Based on its EPS guidance of $1.37, the company has a forward P/E ratio of 40.1. The company doesn't issue forward earnings guidance, and the compound average growth rate of its last 6 years of reported EPS is 3.8%. On this basis, the company's PEG ratio is 10.72, which suggests that it is overpriced. In contrast, the market is likely undervaluing Realty in terms of its equity because its P/B ratio is 1.16 while the sector average is 2.24. The company's shares are currently trading 31.3% above their Graham number.
Realty Has an Average Rating of Buy:
The 14 analysts following Realty have set target prices ranging from $52.0 to $74.0 per share, for an average of $66.36 with a buy rating. As of April 2023, the company is trading -17.3% away from its average target price, indicating that there is an analyst consensus of strong upside potential.
Realty has a very low short interest because 1.9% of the company's shares are sold short. Institutions own 82.6% of the company's shares, and the insider ownership rate stands at 0.1%, suggesting a small amount of insider investors. The largest shareholder is Vanguard Group Inc, whose 15% stake in the company is worth $5,437,236,673.