UnitedHealth logged a -0.0% change during today's morning session, and is now trading at a price of $524.05 per share.
UnitedHealth returned gains of 6.0% last year, with its stock price reaching a high of $558.1 and a low of $445.68. Over the same period, the stock underperformed the S&P 500 index by -17.0%. As of April 2023, the company's 50-day average price was $498.1. UnitedHealth Group Incorporated operates as a diversified health care company in the United States. Based in Minnetonka, MN, the large-cap Health Care company has 400,000 full time employees. UnitedHealth has offered a 1.3% dividend yield over the last 12 months.
A Pattern of Improving Cash Flows With a Flat Trend:
| 2018-02-13 | 2019-02-12 | 2020-02-14 | 2021-03-01 | 2022-02-15 | 2023-02-24 | |
|---|---|---|---|---|---|---|
| Revenue (MM) | $201,159 | $226,247 | $242,155 | $257,141 | $287,597 | $324,162 |
| Gross Margins | 23.0% | 24.0% | 24.0% | 26.0% | 24.0% | 25.0% |
| Operating Margins | 8% | 8% | 8% | 9% | 8% | 9% |
| Net Margins | 5.0% | 5.0% | 6.0% | 6.0% | 6.0% | 6.0% |
| Net Income (MM) | $10,558 | $11,986 | $13,839 | $15,403 | $17,285 | $20,120 |
| Net Interest Expense (MM) | -$1,186 | -$1,400 | -$1,704 | -$1,663 | -$1,660 | -$2,092 |
| Depreciation & Amort. (MM) | -$2,245 | -$2,428 | -$2,720 | -$2,891 | -$3,103 | -$3,400 |
| Earnings Per Share | $10.72 | $12.19 | $14.33 | $16.03 | $18.1 | $21.18 |
| EPS Growth | n/a | 13.71% | 17.56% | 11.86% | 12.91% | 17.02% |
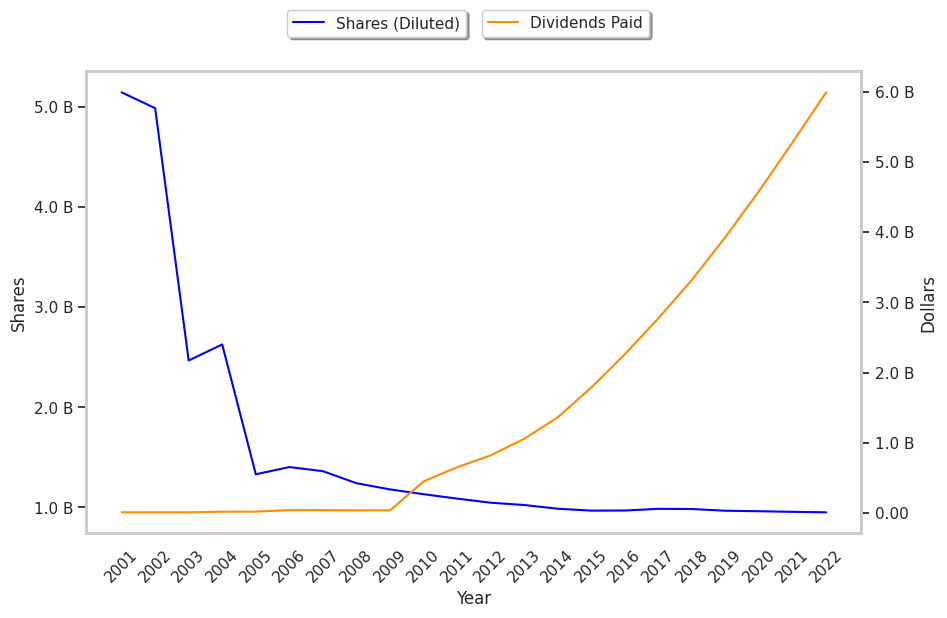
| Diluted Shares (MM) | 985 | 983 | 966 | 961 | 955 | 950 |
| Free Cash Flow (MM) | $15,619 | $17,776 | $20,534 | $24,225 | $24,797 | $29,008 |
| Capital Expenditures (MM) | -$2,023 | -$2,063 | -$2,071 | -$2,051 | -$2,454 | -$2,802 |
| Net Current Assets (MM) | -$49,952 | -$57,302 | -$69,093 | -$73,032 | -$73,969 | -$90,289 |
| Long Term Debt (MM) | $28,835 | $34,581 | $36,808 | $38,648 | $42,383 | $54,513 |
| Net Debt / EBITDA | 0.93 | 1.12 | 1.18 | 0.94 | 0.82 | 0.93 |
UnitedHealth has a pattern of improving cash flows, a strong EPS growth trend, and healthy leverage. However, the firm has slimmer gross margins than its peers. Finally, we note that UnitedHealth has weak revenue growth and a flat capital expenditure trend and weak operating margings with a stable trend.
UnitedHealth's Valuation Is in Line With Its Sector Averages:
UnitedHealth has a trailing twelve month P/E ratio of 22.3, compared to an average of 24.45 for the Health Care sector. Based on its EPS guidance of $27.87, the company has a forward P/E ratio of 17.9. UnitedHealth's PEG ratio is 2.42 on the basis of the 9.2% weighted average of the company and the broader market's EPS compound average growth rates. This suggests that the company's shares are overvalued. Furthermore, UnitedHealth is likely overvalued compared to the book value of its equity, since its P/B ratio of 5.9 is higher than the sector average of 4.16. The company's shares are currently trading 151.8% above their Graham number. Ultimately, UnitedHealth's strong cash flows, decent earnings multiple, and healthy debt levels factor towards it being fairly valued, its elevated P/B ratio notwithstanding.
UnitedHealth Has an Average Rating of Buy:
The 23 analysts following UnitedHealth have set target prices ranging from $520.0 to $650.0 per share, for an average of $570.87 with a buy rating. As of April 2023, the company is trading -12.7% away from its average target price, indicating that there is an analyst consensus of some upside potential.
UnitedHealth has a very low short interest because 0.6% of the company's shares are sold short. Institutions own 89.0% of the company's shares, and the insider ownership rate stands at 0.27%, suggesting a small amount of insider investors. The largest shareholder is Vanguard Group Inc, whose 9% stake in the company is worth $43,966,295,716.