Oil & Gas Integrated firm Valero Energy is one of the rare companies that fulfills most of Graham’s requirements for a defensive high-quality stock.
At Market Inference, we adhere to Benjamin Graham’s view that precise forecasting of a company’s prospects is highly uncertain. Investing with a wide margin of safety, determined on the basis of the company’s historical track record, offers far greater chances of positive investment results.
Valero Energy trades at Attractive Multiples
Benjamin Graham's so-called “Graham number” is a popular metric determining the fair price of a stock in relation to its earnings and the book value of its equity. We calculate the Graham number as √(22.5 * 6 year average earnings per share (8.37) * 6 year average book value per share (73.207), which for Valero Energy gives us a fair price of $205.24.
In comparison, Valero Energy’s market price is $130.22 per share. The analysis shouldn’t end here. The Graham number is just one of seven requirements for defensive stocks listed in Chapter 14 of The Intelligent Investor, which we will review below.
Impressive Revenues, Consistent Profitability, and a Growing Dividend Imply Value
Valero Energy’s average sales revenue over the last 6 years has been $184.5 Billion, so by Graham’s standards the stock has sufficient revenues to make it worthy of investment. When published in 1972, Graham’s threshold was $100 million in average sales, which would be the equivalent of around a half million dollars today.
Ben Graham believed that a margin of safety could be obtained by investing only in companies with consistently positive retained earnings. Retained earnings represent the cumulative net earnings or (deficit) left to equity holders after dividends have been paid out. Valero Energy had positive retained earnings from 2008 to 2022 with an average of $23.64 Billion over this period.
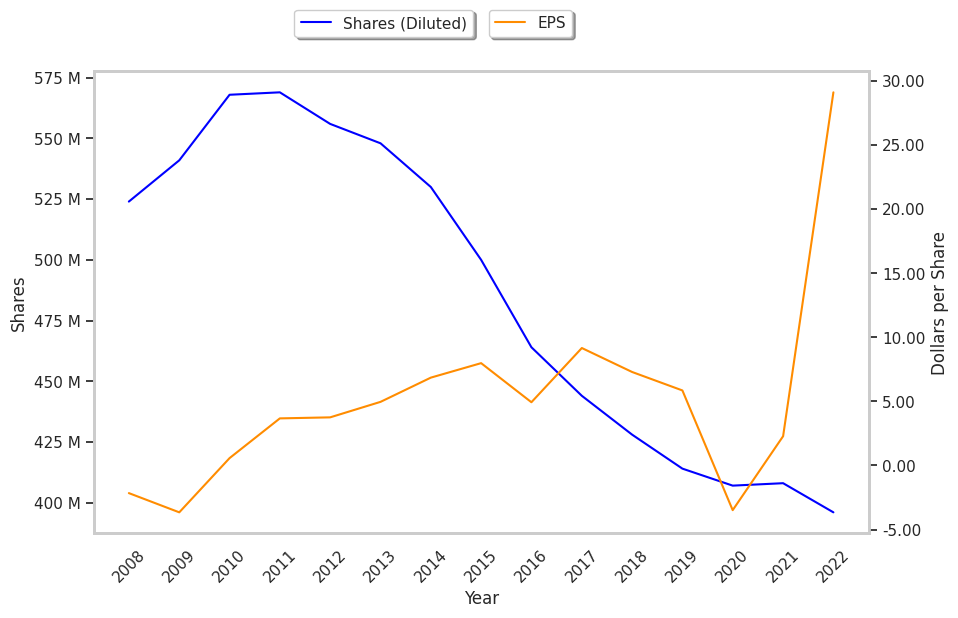
Ben Graham would also require a cumulative growth of Earnings Per Share of at least 30% over the last ten years.To determine Valero Energy's EPS growth over time, we will average out its EPS for 2007, 2008, and 2009, which were $8.88, $-2.16, and $-2.51 respectively. This gives us an average of $1.40 for the period of 2007 to 2009. Next, we compare this value with the average EPS reported in 2020, 2021, and 2022, which were $-3.50, $2.27, and $29.04, for an average of $9.27. Now we see that Valero Energy's EPS growth was 562.14% during this period, which satisfies Ben Graham's requirement.
Negative Current Asset to Liabilities Balance and an Average Current Ratio
Graham sought companies with extremely low debt levels compared to their assets. For one, he expected their current ratio to be over 2 and their long term debt to net current asset ratio to be near, or ideally under, under 1. Valero Energy fails on both counts with a current ratio of 1.4 and a debt to net current asset ratio of -0.9.
Conclusion
Graham is best known for the Graham number valuation method, and his net-net strategy of investing in a broad portfolio of companies that trade below their net current asset value. But these approaches are too narrow, and fail to capture the full scope of Graham’s statistical approach to stock picking.
Valero Energy offers a rare combination of value, growth, and profitability. So it comes as no surprise that the company isn’t cheap enough to meet Graham’s definition of a net-net, and that it does not trade, on average, far below its Graham number. Rather, Valero Energy is an interesting company because it meets Graham’s broader definition of quality.
| 2018-02-28 | 2019-02-28 | 2020-02-26 | 2021-02-23 | 2022-02-22 | 2023-02-23 | |
|---|---|---|---|---|---|---|
| Revenue (MM) | $93,980 | $117,033 | $108,324 | $64,912 | $113,977 | $176,383 |
| Gross Margins | 5.0% | 5.0% | 4.0% | -1.0% | 3.0% | 10.0% |
| Operating Margins | 4% | 4% | 4% | -2% | 2% | 9% |
| Net Margins | 4.0% | 3.0% | 2.0% | -2.0% | 1.0% | 7.0% |
| Net Income (MM) | $4,065 | $3,122 | $2,422 | -$1,421 | $930 | $11,528 |
| Net Interest Expense (MM) | -$468 | -$470 | -$454 | -$563 | -$603 | -$562 |
| Depreciation & Amort. (MM) | -$1,986 | -$2,069 | -$2,255 | -$2,351 | -$2,405 | -$2,473 |
| Earnings Per Share | $9.16 | $7.29 | $5.85 | -$3.49 | $2.28 | $29.11 |
| EPS Growth | n/a | -20.41% | -19.75% | -159.66% | 165.33% | 1176.75% |
| Diluted Shares (MM) | 444 | 428 | 414 | 407 | 408 | 396 |
| Free Cash Flow (MM) | $6,835 | $6,242 | $7,158 | $1,962 | $6,102 | $13,330 |
| Capital Expenditures (MM) | -$1,353 | -$1,871 | -$1,627 | -$1,014 | -$243 | -$756 |
| Net Current Assets (MM) | -$7,946 | -$9,749 | -$12,359 | -$16,288 | -$16,906 | -$11,381 |
| Long Term Debt (MM) | $8,750 | $8,871 | $9,178 | $13,954 | $12,606 | $10,526 |
| Net Debt / EBITDA | 0.54 | 0.92 | 1.16 | 14.72 | 2.15 | 0.37 |