Residential Construction company D.R. Horton is taking Wall Street by surprise today, falling to $104.28 and marking a -4.0% change compared to the S&P 500, which moved 0.0%. DHI is -26.79% below its average analyst target price of $142.44, which implies there is more upside for the stock.
As such, the average analyst rates it at buy. Over the last year, D.R. Horton shares have outstripped the S&P 500 by 28.0%, with a price change of 48.0%.
D.R. Horton, Inc. operates as a homebuilding company in East, North, Southeast, South Central, Southwest, and Northwest regions in the United States. The company is a consumer cyclical company, whose sales and revenues correlate with periods of economic expansion and contraction. The reason behind this is that when the economy is growing, the average consumer has more money to spend on the discretionary (non necessary) products that cyclical consumer companies tend to offer. Consumer cyclical stocks may offer more growth potential than non-cyclical or defensive stocks, but at the expense of higher volatility.
D.R. Horton's trailing 12 month P/E ratio is 7.4, based on its trailing EPS of $14.05. The company has a forward P/E ratio of 7.5 according to its forward EPS of $13.85 -- which is an estimate of what its earnings will look like in the next quarter. The P/E ratio is the company's share price divided by its earnings per share. In other words, it represents how much investors are willing to spend for each dollar of the company's earnings (revenues minus the cost of goods sold, taxes, and overhead). As of the first quarter of 2023, the consumer discretionary sector has an average P/E ratio of 22.33, and the average for the S&P 500 is 15.97.
One limitation P/E ratios is that they don't tell us to what extent future growth expectations are priced into D.R. Horton market valuation. For example, a company with a low P/E ratio may not actually be a good value if it has little growth potential. On the other hand, it's possible for companies with high P/E ratios to be fairly valued in terms of their growth expectations.
Dividing D.R. Horton's P/E ratio by its projected 5 year earnings growth rate gives us its Price to Earnings Growth (PEG) ratio of -1.3. Since it's negative, either the company's current P/E ratio or its growth rate is negative -- neither of which is a good sign.
An analysis of the company's gross profit margins can help us understand its long term profitability and market position. Gross profits are the company's revenue minus the cost of goods only, and unlike earnings, don't take into account taxes and overhead. Here's an overview of D.R. Horton's gross profit margin trends:
| Date Reported | Revenue ($ k) | Cost of Revenue ($ k) | Gross Margins (%) | YoY Growth (%) |
|---|---|---|---|---|
| 2022-10-01 | 33,480,000 | -22,975,900 | 31 | 10.71 |
| 2021-10-01 | 27,774,200 | -19,899,200 | 28 | 16.67 |
| 2020-10-01 | 20,311,100 | -15,373,200 | 24 | 9.09 |
| 2019-10-01 | 17,592,900 | -13,720,900 | 22 | -4.35 |
| 2018-10-01 | 16,068,000 | -12,398,100 | 23 | 4.55 |
| 2017-10-01 | 14,091,000 | -11,042,800 | 22 |
- Average gross margin: 25.0 %
- Average gross margin growth rate: 0.2 %
- Coefficient of variability (lower numbers indicating more stability): 14.8 %
We can see from the above that D.R. Horton business is not strong and its stock is likely not suitable for conservative investors.
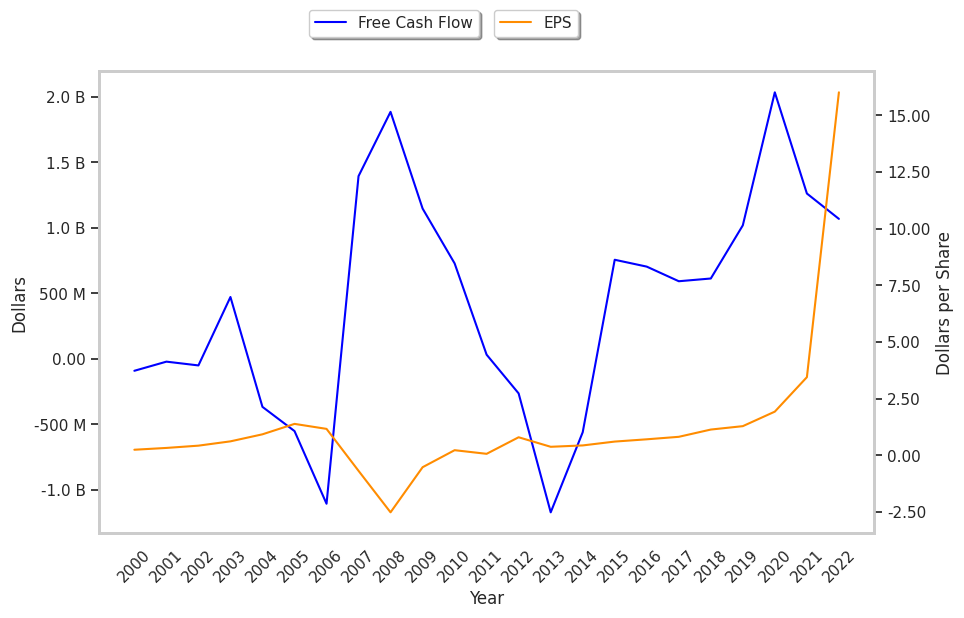
When we subtract capital expenditures from operating cash flows, we are left with the company's free cash flow, which for D.R. Horton was $1.07 Billion as of its last annual report. The balance of cash flows represents the capital that is available for re-investment in the business, or for payouts to equity investors as dividends. The company's average cash flow over the last 4 years has been $1.1 Billion and they've been growing at an average rate of 0.0%. DHI's weak free cash flow trend shows that it might not be able to sustain its dividend payments, which over the last 12 months has yielded 0.9% to investors. Cutting the dividend can compound a company's problems by causing investors to sell their shares, which further pushes down its stock price.
Value investors often analyze stocks through the lens of its Price to Book (P/B) Ratio (its share price divided by its book value). The book value refers to the present value of the company if the company were to sell off all of its assets and pay all of its debts today - a number whose value may differ significantly depending on the accounting method. D.r. horton's P/B ratio indicates that the market value of the company exceeds its book value by a factor of 1.63, but is still below the average P/B ratio of the Consumer Discretionary sector, which stood at 3.12 as of the first quarter of 2023.
D.R. Horton is likely undervalued at today's prices because it has a very low P/E ratio, a lower P/B ratio than its sector average, and irregular cash flows with a flat trend. The stock has strong growth indicators because of its average net margins with a positive growth rate, and a PEG ratio of less than 1. We hope this preliminary analysis will encourage you to do your own research into DHI's fundamental values -- especially their trends over the last few years, which provide the clearest picture of the company's valuation.