Now trading at a price of $102.25, Expedia has moved -1.3% so far today.
Expedia returned gains of 12.0% last year, with its stock price reaching a high of $124.95 and a low of $82.39. Over the same period, the stock underperformed the S&P 500 index by -8.0%. As of April 2023, the company's 50-day average price was $105.88. Expedia Group, Inc. operates as an online travel company in the United States and internationally. Based in Seattle, WA, the large-cap Consumer Discretionary company has 16,500 full time employees. Expedia has not offered a dividend during the last year.
The Business Has Weak Operating Margins:
| 2018-02-14 | 2019-04-29 | 2020-04-29 | 2021-02-12 | 2022-02-11 | 2023-02-10 | |
|---|---|---|---|---|---|---|
| Revenue (MM) | $10,060 | $11,223 | $12,067 | $5,199 | $8,598 | $11,667 |
| Operating Margins | 6% | 8% | 8% | -28% | 3% | 10% |
| Net Margins | 4.0% | 4.0% | 5.0% | -50.0% | 0.0% | 3.0% |
| Net Income (MM) | $378 | $406 | $565 | -$2,612 | $12 | $352 |
| Net Interest Expense (MM) | -$148 | -$119 | -$114 | -$342 | -$342 | -$217 |
| Depreciation & Amort. (MM) | -$889 | -$676 | -$910 | -$893 | -$814 | -$792 |
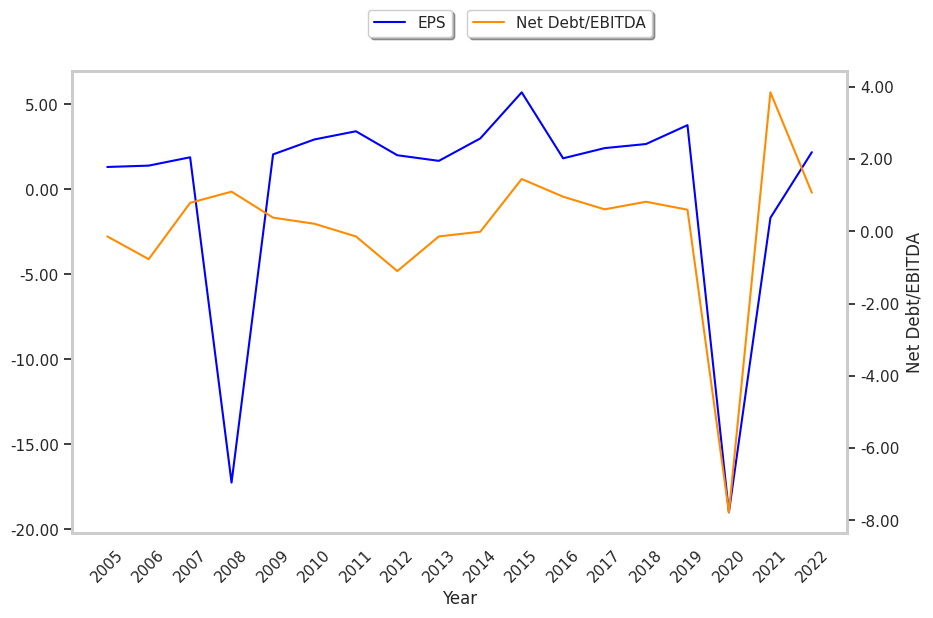
| Earnings Per Share | $2.42 | $2.66 | $3.77 | -$19.0 | -$1.68 | $2.18 |
| EPS Growth | n/a | 9.92% | 41.73% | -603.98% | 91.16% | 229.76% |
| Diluted Shares (MM) | 156 | 153 | 150 | 141 | 160 | 162 |
| Free Cash Flow (MM) | $2,555 | $2,853 | $3,927 | -$3,037 | $4,421 | $4,102 |
| Capital Expenditures (MM) | -$710 | -$878 | -$1,160 | -$797 | -$673 | -$662 |
| Net Current Assets (MM) | -$6,825 | -$7,155 | -$8,145 | -$9,030 | -$9,815 | -$9,042 |
| Long Term Debt (MM) | $3,749 | $3,717 | $4,189 | $8,216 | $7,715 | $6,240 |
A Lower P/E Ratio Than Its Sector Average but Trades Above Its Graham Number:
Expedia has a trailing twelve month P/E ratio of 18.3, compared to an average of 22.33 for the Consumer Discretionary sector. Based on its EPS guidance of $11.63, the company has a forward P/E ratio of 9.1. The company doesn't provide forward earnings guidance, and the compound average growth rate of its last 6 years of reported EPS is 15.6%. On this basis, Expedia's PEG ratio is 1.17. Using instead the 9.7% weighted average of Expedia's earnings CAGR and the broader market's anticipated 5-year EPS growth rate, the company's PEG ratio is 1.89, which suggests that its shares may be overpriced. Furthermore, Expedia is likely overvalued compared to the book value of its equity, since its P/B ratio of 8.39 is higher than the sector average of 3.12. The company's shares are currently trading 204.1% above their Graham number.
Analysts Give Expedia an Average Rating of Buy:
The 29 analysts following Expedia have set target prices ranging from $90.0 to $200.0 per share, for an average of $126.72 with a buy rating. As of April 2023, the company is trading -16.4% away from its average target price, indicating that there is an analyst consensus of some upside potential.
Expedia has an above average percentage of its shares sold short because 8.0% of the company's shares are sold short. Institutions own 97.1% of the company's shares, and the insider ownership rate stands at 0.5%, suggesting a small amount of insider investors. The largest shareholder is Vanguard Group Inc, whose 12% stake in the company is worth $1,682,229,576.