It's been a great afternoon session for Sirius XM investors, who saw their shares rise 2.6% to a price of $4.71 per share. At these higher prices, is the company still fairly valued? If you are thinking about investing, make sure to check the company's fundamentals before making a decision.
Sirius XM Is Too Expensive at Current Levels:
Sirius XM Holdings Inc., an audio entertainment company, operates audio business including subscription entertainment services in the United States. The company belongs to the Consumer Discretionary sector, which has an average price to earnings (P/E) ratio of 22.33. In contrast, Sirius XM has a trailing 12 month P/E ratio of 15.7 based on its earnings per share of $0.3.
There is an important limit on the usefulness of P/E ratios. Since the P/E ratio is the share price divided by earnings per share, the ratio is determined partially by market sentiment on the stock. Sometimes a negative sentiment translates to a lower market price and therefore a lower P/E ratio -- and there might be good reasons for this negative sentiment.
One of the main reasons not to blindly invest in a company with a low P/E ratio is that it might have low growth expectations. Low growth correlates with low stock performance, so it's useful to factor growth into the valuation process. One of the easiest ways to do this is to divide the company's P/E ratio by its expected growth rate, which results in the price to earnings growth, or PEG ratio.
Sirius XM's PEG ratio is 1.96, which shows that the stock is overvalued in terms of its estimated growth. For reference, a PEG ratio near or below 1 is a potential signal that a company is undervalued.
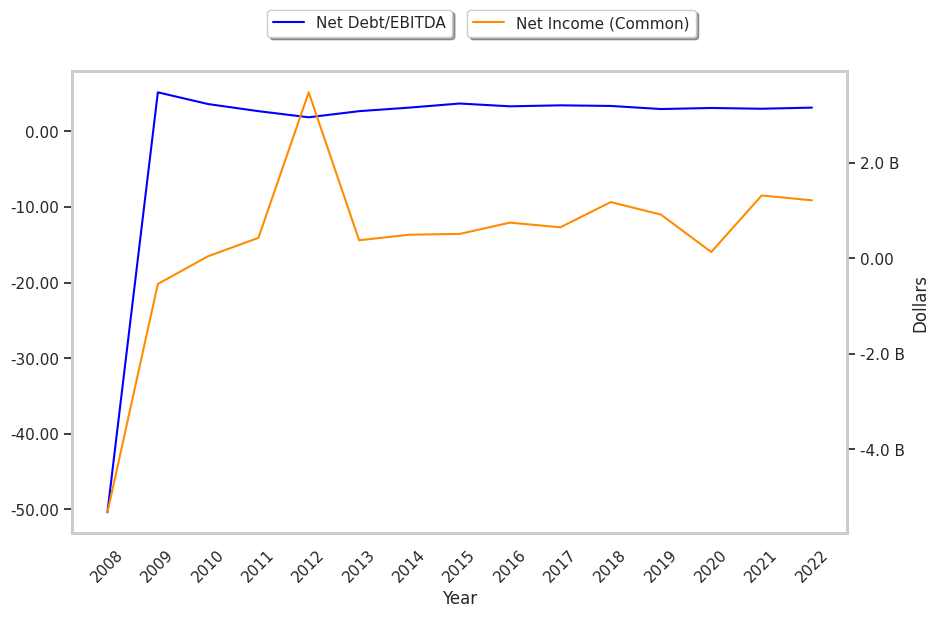
Exceptional Profitability Overshadowed by Excessive Leverage:
| 2018-01-31 | 2019-01-30 | 2020-02-04 | 2021-02-02 | 2022-02-01 | 2023-02-02 | |
|---|---|---|---|---|---|---|
| Revenue (MM) | $5,425 | $5,771 | $7,794 | $8,040 | $8,696 | $9,003 |
| Gross Margins | 84.0% | 84.0% | 56.0% | 55.0% | 54.0% | 54.0% |
| Operating Margins | 30% | 30% | 28% | 28% | 27% | 27% |
| Net Margins | 12.0% | 20.0% | 12.0% | 2.0% | 15.0% | 13.0% |
| Net Income (MM) | $648 | $1,176 | $914 | $131 | $1,314 | $1,213 |
| Net Interest Expense (MM) | -$346 | -$350 | -$390 | -$394 | -$415 | -$422 |
| Depreciation & Amort. (MM) | -$299 | -$301 | -$468 | -$506 | -$533 | -$536 |
| Earnings Per Share | $0.14 | $0.26 | $0.2 | $0.03 | $0.32 | $0.3 |
| EPS Growth | n/a | 85.71% | -23.08% | -85.0% | 966.67% | -6.25% |
| Diluted Shares (MM) | 4,724 | 4,561 | 4,616 | 4,429 | 4,119 | 3,990 |
| Free Cash Flow (MM) | $2,144 | $2,235 | $2,380 | $2,368 | $2,386 | $2,387 |
| Capital Expenditures (MM) | -$288 | -$355 | -$363 | -$350 | -$388 | -$411 |
| Net Current Assets (MM) | -$9,382 | -$9,511 | -$10,882 | -$11,651 | -$11,719 | -$12,335 |
| Long Term Debt (MM) | $6,741 | $6,885 | $7,842 | $8,499 | $8,832 | $9,256 |
| Net Debt / EBITDA | 3.44 | 3.36 | 2.95 | 3.09 | 2.99 | 3.14 |
Sirius XM has strong margins with a stable trend, wider gross margins than its peer group, and a strong EPS growth trend. However, the firm has a highly leveraged balance sheet. Finally, we note that Sirius XM has weak revenue growth and a flat capital expenditure trend and irregular cash flows.