One of the biggest losers as of today's evening session is software company Block, whose shares are down -5.0%, underperforming the Nasdaq by -4.0%.
At $43.17, SQ is 43.47% below its average analyst target price of $76.37.
The average analyst rating for the stock is buy. SQ lagged -5.0% behind the S&P 500 index today, and by -38.0% over the last year, returning -16.0%.
Block does not release its trailing 12 month P/E ratio since its earnings per share of $-0.42 are negative over the last year. But we can calculate it ourselves, which gives us a trailing P/E ratio for SQ of -102.8. Based on the company's positive earnings guidance of $2.36, the stock has a forward P/E ratio of 18.3. As of the first quarter of 2023, the average Price to Earnings (P/E) ratio of US technology companies is 27.16, and the S&P 500 average is 15.97. The P/E ratio consists in the stock's share price divided by its earnings per share (EPS), representing how much investors are willing to spend for each dollar of the company's earnings. Earnings are the company's revenues minus the cost of goods sold, overhead, and taxes.
The main limitation with P/E ratios is that they don't take into account the growth of earnings. This means that a company with a higher than average P/E ratio may still be undervalued if it has high projected earnings growth. Conversely, a company with a low P/E ratio may not present a good value proposition if its projected earnings are stagnant.
When we divide Block's P/E ratio by its projected 5 year earnings growth rate, we obtain its Price to Earnings Growth (PEG) ratio of 0.44. Since a PEG ratio of 1 or less may indicate that the company's valuation is proportionate to its growth potential, we see here that investors are undervaluing SQ's growth potential .
To understand a company's long term business prospects, we must consider its gross profit margins, which is the ratio of its gross profits to its revenues. A wider gross profit margin indicates that a company may have a competitive advantage, as it is free to keep its product prices high relative to their cost. After looking at its annual reports, we obtained the following information on SQ's margins:
| Date Reported | Revenue ($ k) | Cost of Revenue ($ k) | Gross Margins (%) | YoY Growth (%) |
|---|---|---|---|---|
| 2023-02-23 | 17,531,587 | -11,539,695 | 34 | 36.0 |
| 2022-02-24 | 17,661,203 | -13,241,380 | 25 | -10.71 |
| 2021-02-23 | 9,497,578 | -6,764,169 | 28 | -30.0 |
| 2020-02-26 | 4,713,500 | -2,823,815 | 40 | 0.0 |
| 2019-02-27 | 3,298,177 | -1,994,477 | 40 | 5.26 |
| 2018-02-27 | 2,214,253 | -1,374,947 | 38 |
- Average gross margin: 34.2%
- Average gross margin growth rate: 0.1%
- Coefficient of variability (higher numbers indicating more instability): 18.7%
We can see from the above that Block business is not strong and its stock is likely not suitable for conservative investors.
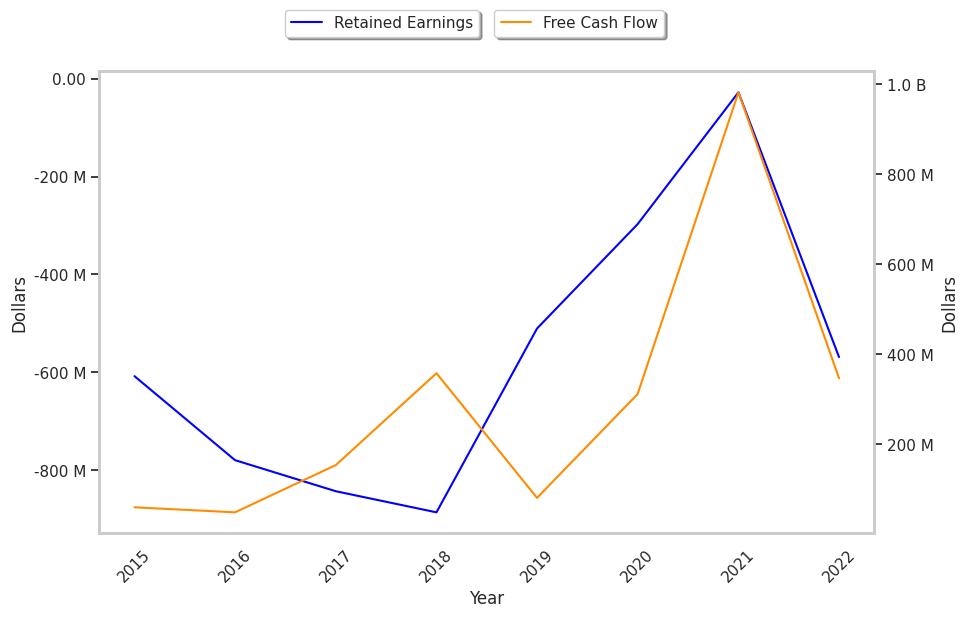
Block's financial viability can also be assessed through a review of its free cash flow trends. Free cash flow refers to its operating cash flows minues its capital expenditures, which are expenses related to the maintenance of fixed assets such as land, infrastructure, and equipment. Over the last four years, the trends have been as follows:
| Date Reported | Cash Flow from Operations ($ k) | Capital expenditures ($ k) | Free Cash Flow ($ k) | YoY Growth (%) |
|---|---|---|---|---|
| 2023-02-23 | 175,903 | -170,815 | 346,718 | -64.7 |
| 2022-02-24 | 847,830 | -134,320 | 982,150 | 215.28 |
| 2021-02-23 | 173,110 | -138,402 | 311,512 | 285.52 |
| 2020-02-26 | 327,630 | 246,826 | 80,804 | -77.42 |
| 2019-02-27 | 295,080 | -62,787 | 357,867 | 132.67 |
| 2018-02-27 | 127,711 | -26,097 | 153,808 |
- Average free cash flow: $372.14 Million
- Average free cash flow growth rate: 0.0%
- Coefficient of variability (lower numbers indicating more stability): 389683878.9%
Free cash flows represents the amount of money that is available for reinvesting in the business, or paying out to investors in the form of a dividend. With a positive cash flow as of the last fiscal year, SQ is in a position to do either -- which can encourage more investors to place their capital in the company.
Value investors often analyze stocks through the lens of its Price to Book (P/B) Ratio (its share price divided by its book value). As of the first quarter of 2023, the mean P/B ratio of the technology sector is 6.23, compared to the S&P 500 average of 2.95. The book value refers to the present value of the company if the company were to sell off all of its assets and pay all of its debts today - a number whose value may differ significantly depending on the accounting method. Block's P/B ratio is 1.48, telling us that the market value of the company exceeds its book value by a factor of 1, but is still below the average P/B ratio of the Technology sector.
Since it has a negative P/E ratio, a lower P/B ratio than its sector average, irregular cash flows with a flat trend, Block is likely fairly valued at today's prices. The company has poor growth indicators because of a negative PEG ratio and weak operating margins with a negative growth trend. We hope you enjoyed this basic overview of SQ's fundamentals. Make sure to check the numbers for yourself, especially focusing on their trends over the last few years.