It's been a great morning session for Broadcom investors, who saw their shares rise 2.1% to a price of $901.7 per share. At these higher prices, is the company still fairly valued? If you are thinking about investing, make sure to check the company's fundamentals before making a decision.
Broadcom's Valuation Is in Line With Its Sector Averages:
Broadcom Inc. designs, develops, and supplies various semiconductor devices with a focus on complex digital and mixed signal complementary metal oxide semiconductor based devices and analog III-V based products worldwide. The company belongs to the Technology sector, which has an average price to earnings (P/E) ratio of 27.16 and an average price to book (P/B) ratio of 6.23. In contrast, Broadcom has a trailing 12 month P/E ratio of 27.7 and a P/B ratio of 16.87.
Broadcom's PEG ratio is 1.95, which shows that the stock is probably overvalued in terms of its estimated growth. For reference, a PEG ratio near or below 1 is a potential signal that a company is undervalued.
The Company Enjoys Exceptional EPS Growth:
| 2017-12-13 | 2018-12-21 | 2019-12-20 | 2020-12-18 | 2021-12-17 | 2022-12-09 | |
|---|---|---|---|---|---|---|
| Revenue (MM) | $17,636 | $20,848 | $22,597 | $23,888 | $27,450 | $33,203 |
| Gross Margins | 48.0% | 51.0% | 55.0% | 56.0% | 61.0% | 67.0% |
| Operating Margins | 15% | 26% | 18% | 18% | 32% | 43% |
| Net Margins | 10.0% | 59.0% | 12.0% | 12.0% | 25.0% | 35.0% |
| Net Income (MM) | $1,692 | $12,259 | $2,724 | $2,960 | $6,736 | $11,495 |
| Net Interest Expense (MM) | -$454 | -$628 | -$1,444 | -$1,777 | -$1,885 | -$1,737 |
| Depreciation & Amort. (MM) | -$4,737 | -$4,081 | -$5,808 | -$570 | -$539 | -$529 |
| Earnings Per Share | $4.02 | $28.44 | $6.43 | $6.33 | $15.29 | $26.53 |
| EPS Growth | n/a | 607.46% | -77.39% | -1.56% | 141.55% | 73.51% |
| Diluted Shares (MM) | 421 | 431 | 419 | 421 | 421 | 423 |
| Free Cash Flow (MM) | $7,179 | $9,276 | $10,041 | $12,524 | $14,207 | $17,160 |
| Capital Expenditures (MM) | -$628 | -$396 | -$344 | -$463 | -$443 | -$424 |
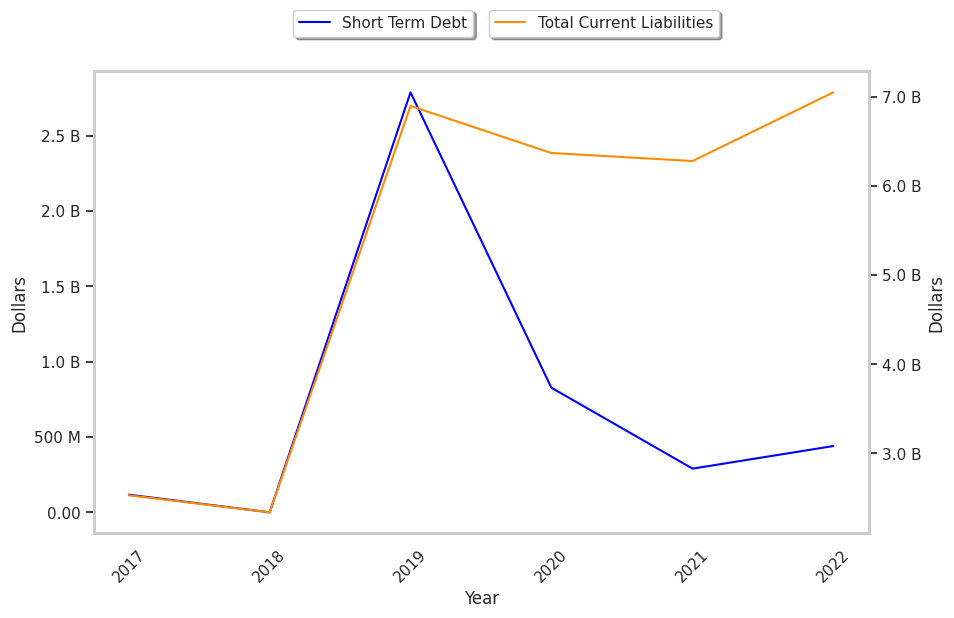
| Net Current Assets (MM) | -$15,409 | -$14,360 | -$32,606 | -$40,137 | -$33,995 | -$32,036 |
| Long Term Debt (MM) | $17,431 | $17,493 | $30,011 | $40,235 | $39,440 | $39,075 |
| Net Debt / EBITDA | 0.86 | 1.4 | 2.78 | 6.99 | 2.99 | 1.83 |
Broadcom has exceptional EPS growth and a pattern of improving cash flows. Additionally, the company's financial statements display an excellent current ratio and healthy leverage. However, the firm has slimmer gross margins than its peers. Finally, we note that Broadcom has weak revenue growth and a flat capital expenditure trend and average net margins with a positive growth rate.