Based on the factors that Benjamin Graham considered in analyzing potential stock picks, Delta Air Lines is not a quality investment. Only investors with a high risk tolerance and a solid investment thesis on the stock will be interested in this large-cap Airlines company.
Delta Air Lines Is Probably Overvalued
Graham devised the below equation to give investors a quick way of determining whether a stock is trading at a fair multiple of its earnings and its assets:
√(22.5 * 6 year average earnings per share (0.07) * 6 year average book value per share (14.408) = $21.82
At today's price of $34.28 per share, Delta Air Lines is now trading 57.1% above the maximum price that Graham would have wanted to pay for the stock.
Even though the stock does not trade at an attractive multiple, it might still meet some of the other criteria for quality stocks that Graham listed in Chapter 14 of The Intelligent Investor.
Negative Retained Earnings In 2011, 2012, And 2020, An Acceptable Record Of Dividends, and Some Eps Growth
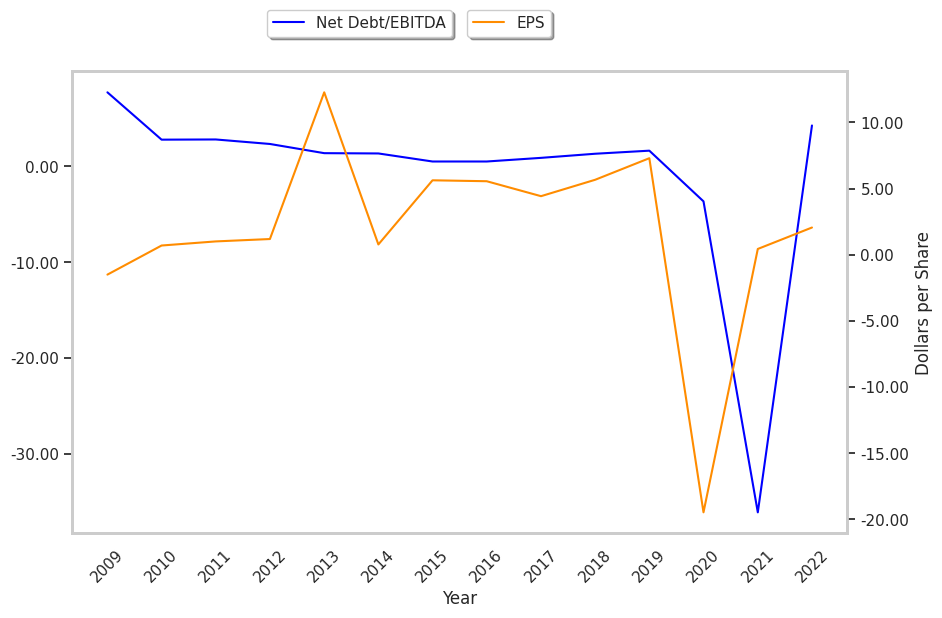
Ben Graham wrote that an investment in a company with a record of positive retained earnings could contribute significantly to the margin of safety. However, Delta Air Lines had negative retained earnings in 2011, 2012, and 2020 with an average of $1.17 Billion over this period.
Another one of Graham's requirements is for a 30% or more cumulative growth rate of the company's earnings per share over the last ten years.Delta Air Lines's earnings per share growth will be calculated using the average EPS of the years 2008, 2009, and 2010, and the average of the years 2020, 2021, and 2022. For the years starting in 2008, we have EPS values of $-19.08, $-1.50, and $0.02, which give us an average of $-6.85. From 2020 to the present, we have EPS values of $-19.49, $0.44, and $2.06, which average out to $-5.66. The growth rate between the two averages is 17.37%, which falls short of Graham's 30% requirement while remaining positive.
Shareholders of Delta Air Lines have received regular dividends since 2013. The company has returned an average dividend yield of 2.3% over the last five years.
Negative Current Asset to Liabilities Balance and Not Enough Current Assets to Cover Current Liabilities
Graham sought companies with extremely low debt levels compared to their assets. For one, he expected their current ratio to be over 2 and their long term debt to net current asset ratio to be near, or ideally under, under 1. Delta Air Lines fails on both counts with a current ratio of 0.5 and a debt to net current asset ratio of -0.5.
According to Graham's analysis, Delta Air Lines is likely a company of low quality, which is trading far above its fair price.
| 2018-02-23 | 2019-02-15 | 2020-02-13 | 2021-02-12 | 2022-02-11 | 2023-02-10 | |
|---|---|---|---|---|---|---|
| Revenue (MM) | $41,138 | $44,438 | $47,007 | $17,095 | $29,899 | $50,582 |
| Gross Margins | 31.0% | 28.0% | 32.0% | -23.0% | 6.0% | 20.0% |
| Operating Margins | 15% | 12% | 14% | -48% | -9% | 7% |
| Net Margins | 8.0% | 9.0% | 10.0% | -72.0% | 1.0% | 3.0% |
| Net Income (MM) | $3,205 | $3,935 | $4,767 | -$12,385 | $280 | $1,318 |
| Net Interest Expense (MM) | -$396 | -$311 | -$301 | -$929 | -$1,279 | -$1,029 |
| Depreciation & Amort. (MM) | -$2,222 | -$2,329 | -$2,581 | -$2,312 | -$1,998 | -$2,107 |
| Earnings Per Share | $4.43 | $5.67 | $7.3 | -$19.47 | $0.44 | $2.06 |
| EPS Growth | n/a | 27.99% | 28.75% | -366.71% | 102.26% | 368.18% |
| Diluted Shares (MM) | 723 | 694 | 653 | 636 | 641 | 641 |
| Free Cash Flow (MM) | $6,210 | $12,182 | $10,017 | -$2,790 | $4,915 | $8,234 |
| Capital Expenditures (MM) | -$1,187 | -$5,168 | -$1,592 | -$1,003 | -$1,651 | -$1,871 |
| Net Current Assets (MM) | -$33,337 | -$40,239 | -$40,925 | -$53,058 | -$52,632 | -$52,695 |
| Long Term Debt (MM) | $6,592 | $8,253 | $14,167 | $33,138 | $32,194 | $27,537 |
| Net Debt / EBITDA | 0.89 | 1.32 | 1.64 | -3.65 | -36.11 | 4.27 |