Today we're going to take a closer look at large-cap Energy company Enbridge, whose shares are currently trading at $32.81. We've been asking ourselves whether the company is under or over valued at today's prices... let's perform a brief value analysis to find out!
A Lower P/B Ratio Than Its Sector Average but Trades Above Its Graham Number:
Enbridge Inc., together with its subsidiaries, operates as an energy infrastructure company. The company belongs to the Energy sector, which has an average price to earnings (P/E) ratio of 7.54 and an average price to book (P/B) ratio of 1.68. In contrast, Enbridge has a trailing 12 month P/E ratio of 23.8 and a P/B ratio of 1.23.
Enbridge's PEG ratio is 6.41, which shows that the stock is probably overvalued in terms of its estimated growth. For reference, a PEG ratio near or below 1 is a potential signal that a company is undervalued.
Exceptional Profitability Overshadowed by Excessive Leverage:
| 2018-02-02 | 2019-02-15 | 2020-02-14 | 2021-02-12 | 2022-02-11 | 2023-02-10 | |
|---|---|---|---|---|---|---|
| Revenue (MM) | $44,378 | $46,378 | $50,069 | $39,087 | $47,071 | $53,309 |
| Gross Margins | 35.0% | 37.0% | 38.0% | 47.0% | 39.0% | 39.0% |
| Operating Margins | 14% | 15% | 17% | 20% | 17% | 15% |
| Net Margins | 6.0% | 6.0% | 11.0% | 9.0% | 13.0% | 6.0% |
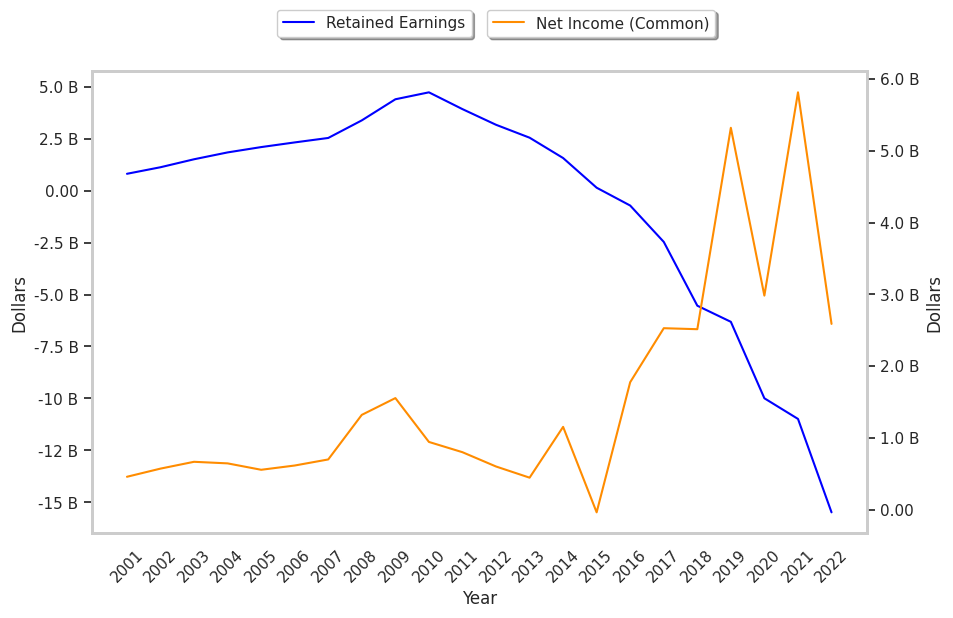
| Net Income (MM) | $2,859 | $2,882 | $5,705 | $3,363 | $6,189 | $3,003 |
| Net Interest Expense (MM) | -$2,556 | -$2,703 | -$2,663 | -$2,790 | -$2,655 | -$3,179 |
| Depreciation & Amort. (MM) | -$3,163 | -$3,246 | -$3,391 | -$3,712 | -$3,852 | -$4,317 |
| Earnings Per Share | $1.25 | $1.25 | $2.63 | $1.47 | $2.87 | $1.28 |
| EPS Growth | n/a | 0.0% | 110.4% | -44.11% | 95.24% | -55.4% |
| Diluted Shares (MM) | 2,020 | 2,020 | 2,021 | 2,023 | 2,026 | 2,020 |
| Free Cash Flow (MM) | $15,106 | $13,396 | $12,980 | $15,136 | $16,086 | $16,051 |
| Capital Expenditures (MM) | -$8,448 | -$2,894 | -$3,582 | -$5,355 | -$6,830 | -$4,821 |
| Net Current Assets (MM) | -$83,079 | -$84,898 | -$85,037 | -$88,563 | -$96,537 | -$104,063 |
| Long Term Debt (MM) | $60,865 | $60,327 | $59,661 | $62,819 | $67,961 | $72,939 |
| Net Debt / EBITDA | 6.96 | 6.29 | 5.33 | 5.69 | 6.46 | 6.41 |
Enbridge has strong margins with a stable trend, wider gross margins than its peer group, and positive EPS growth. However, the firm has a highly leveraged balance sheet. Finally, we note that Enbridge has weak revenue growth and a flat capital expenditure trend and irregular cash flows.