We've been asking ourselves recently if the market has placed a fair valuation on General Electric Company. Let's dive into some of the fundamental values of this large-cap Technology company to determine if there might be an opportunity here for value-minded investors.
General Electric Company's Earnings and Assets May Be Undervalued:
General Electric Company operates as a high-tech industrial company in Europe, China, Asia, the Americas, the Middle East, and Africa. The company belongs to the Technology sector, which has an average price to earnings (P/E) ratio of 27.16 and an average price to book (P/B) ratio of 6.23. In contrast, General Electric Company has a trailing 12 month P/E ratio of 11.8 and a P/B ratio of 3.8.
General Electric Company's PEG ratio is 1.57, which shows that the stock is probably overvalued in terms of its estimated growth. For reference, a PEG ratio near or below 1 is a potential signal that a company is undervalued.
Exceptional EPS Growth Obtained Primarily Through Share Buybacks:
| 2018-02-23 | 2019-02-26 | 2020-02-24 | 2021-02-12 | 2022-02-11 | 2023-02-10 | |
|---|---|---|---|---|---|---|
| Revenue (MM) | $118,244 | $97,012 | $90,221 | $75,834 | $74,196 | $76,556 |
| Gross Margins | 23.0% | 28.0% | 28.0% | 24.0% | 27.0% | 27.0% |
| Operating Margins | 7% | 9% | 9% | 0% | 6% | 8% |
| Net Margins | -7.0% | -23.0% | -6.0% | 8.0% | -9.0% | 0.0% |
| Net Income (MM) | -$8,483 | -$22,354 | -$4,978 | $5,705 | -$6,520 | $224 |
| Net Interest Expense (MM) | -$4,869 | -$4,766 | -$2,927 | -$2,068 | -$1,876 | -$1,607 |
| Depreciation & Amort. (MM) | -$7,429 | -$4,419 | -$3,541 | -$3,464 | -$3,009 | -$3,544 |
| Earnings Per Share | -$6.41 | -$16.38 | -$3.89 | $3.73 | -$4.8 | -$0.06 |
| EPS Growth | n/a | -155.54% | 76.25% | 195.89% | -228.69% | 98.75% |
| Diluted Shares (MM) | 1,391 | 1,392 | 1,397 | 1,403 | 1,408 | 1,098 |
| Free Cash Flow (MM) | $7,658 | $7,513 | $10,574 | $4,942 | $4,415 | $7,078 |
| Capital Expenditures (MM) | -$1,625 | -$2,534 | -$1,837 | -$1,376 | -$1,083 | -$1,162 |
| Net Current Assets (MM) | -$149,427 | -$136,745 | -$132,221 | -$134,285 | -$90,913 | -$83,973 |
| Long Term Debt (MM) | $108,575 | $95,234 | $67,241 | $70,189 | $30,824 | $28,593 |
| Net Debt / EBITDA | 3.09 | 2.9 | 3.83 | 8.16 | 0.97 | 0.79 |
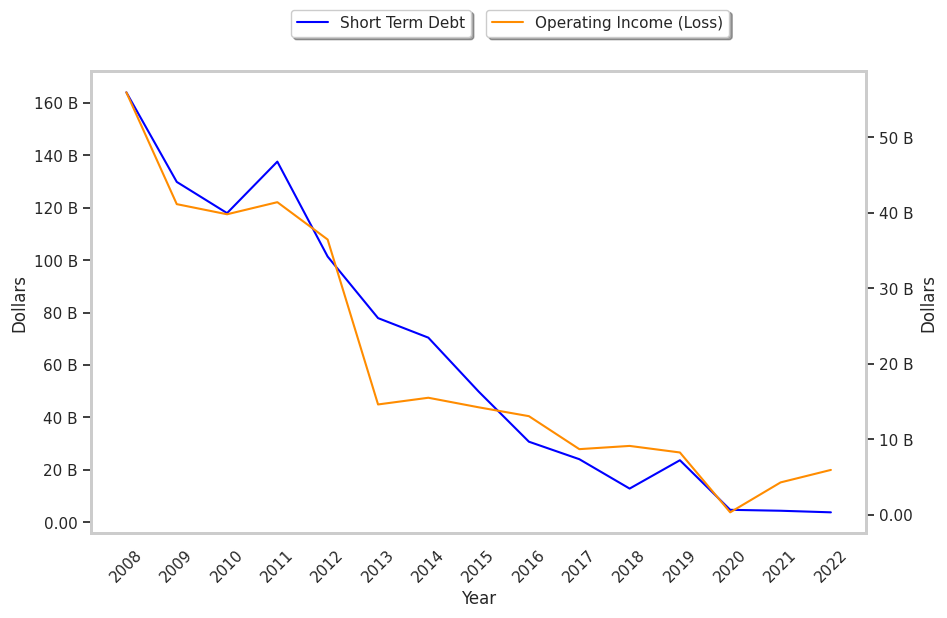
General Electric Company has slimmer gross margins than its peers, exceptional EPS growth obtained primarily through share buybacks, and a highly leveraged balance sheet. On the other hand, the company has decent operating margins with a stable trend working in its favor. Furthermore, General Electric Company has weak revenue growth and a flat capital expenditure trend, irregular cash flows, and just enough current assets to cover current liabilities.