NXP Semiconductors does not have the profile of a defensive investment based on the requirements of Ben Graham. The Semiconductors firm may nonetheless be of interest to more risk-oriented investors who have a solid thesis on the company's future growth. At Market Inference, we remain agnostic as to such further developments, and prefer to use a company's past track record as the bellwether for future potential gains.
NXP Semiconductors Is Probably Overvalued
Graham devised the below equation to give investors a quick way of determining whether a stock is trading at a fair multiple of its earnings and its assets:
√(22.5 * 5 year average earnings per share (5.05) * 5 year average book value per share (31.659) = $83.41
After an impressive 43.0% performance over the 12 months, NXP Semiconductors is now trading well over its fair value because its Graham number is 139.3% above today's share price of $199.56. Even though the stock does not trade at an attractive multiple, it might still meet some of the other criteria for quality stocks that Graham listed in Chapter 14 of The Intelligent Investor.
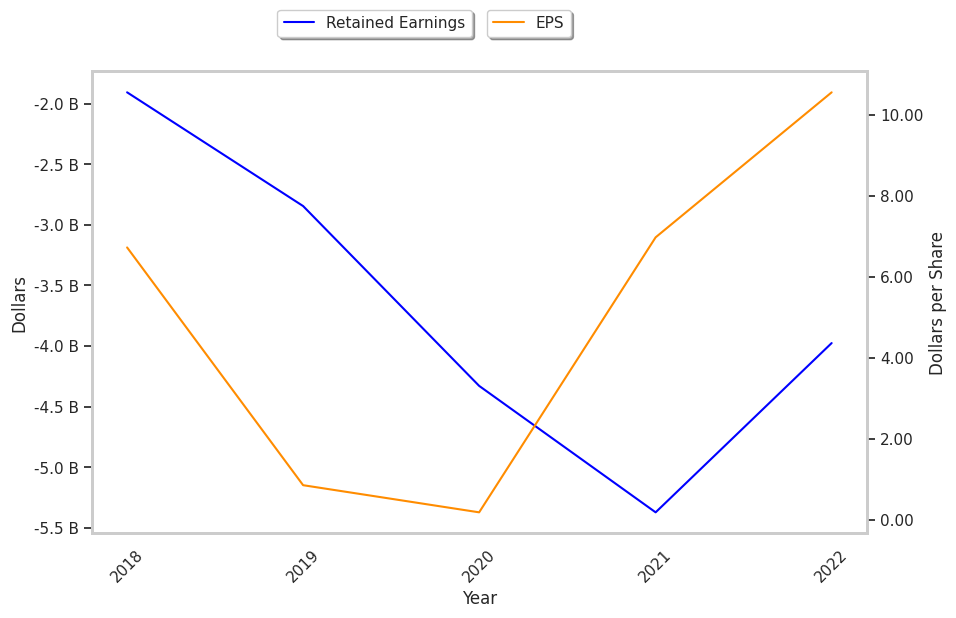
Negative Retained Earnings In 2019, 2020, And 2021, An Acceptable Record Of Dividends, and Eps Growth In Excess Of Graham'S Requirements
Ben Graham wrote that an investment in a company with a record of positive retained earnings could contribute significantly to the margin of safety. However, NXP Semiconductors had negative retained earnings in 2019, 2020, and 2021 with an average of $-3685200000.0 over this period.
Another one of Graham's requirements is for a 30% or more cumulative growth rate of the company's earnings per share over the last ten years.There are only 6 years of EPS data available on NXP Semiconductors, which is short of the required 10, but it's still worthwhile to consider its EPS trend over the available period. First, we will average out its EPS for 2017 and 2018 which were $6.41 and $6.72 respectively. This gives us an average of $6.56 for the period of 2017 to 2018. Next, we compare this value with the average EPS reported in 2021 and 2022, which were $6.79 and $10.55, for an average of $8.67. Now we see that NXP Semiconductors's EPS growth was 32.16% during this period, which satisfies Ben Graham's requirement for growth.
Shareholders of NXP Semiconductors have received regular dividends since 2018. The company has returned an average dividend yield of 1.2% over the last five years.
NXP Semiconductors’s Balance Sheet Meets Graham’s Criteria
It was also essential to Graham that the company’s current assets outweigh its current liabilities, and that its long term debt be inferior to the sum of its net current assets (current assets minus total liabilities). This is the aspect of the analysis that most companies fail, yet NXP Semiconductors passes comfortably, with an average current ratio of 2.1, and average debt to net current asset ratio of -1.3.
Conclusion
According to Graham's analysis, NXP Semiconductors is likely a company of average quality, which does not offer a significant enough margin of safety for a risk averse investor.
| 2019-01-29 | 2020-01-28 | 2021-02-25 | 2022-02-24 | 2023-03-01 | |
|---|---|---|---|---|---|
| Revenue (MM) | $9,407 | $8,877 | $8,612 | $11,063 | $13,205 |
| Gross Margins | 52.0% | 52.0% | 49.0% | 55.0% | 56.0% |
| Operating Margins | 8% | 7% | 4% | 23% | 28% |
| Net Margins | 23.0% | 3.0% | 1.0% | 17.0% | 21.0% |
| Net Income (MM) | $2,208 | $243 | $52 | $1,871 | $2,787 |
| Earnings Per Share | $6.72 | $0.85 | $0.18 | $6.97 | $10.55 |
| EPS Growth | n/a | -87.35% | -78.82% | 3772.22% | 51.36% |
| Diluted Shares (MM) | 329 | 286 | 284 | 269 | 264 |
| Free Cash Flow (MM) | $5,029 | $2,978 | $3,000 | $4,008 | $5,120 |
| Capital Expenditures (MM) | -$660 | -$605 | -$518 | -$931 | -$1,225 |
| Net Current Assets (MM) | -$5,615 | -$7,094 | -$6,372 | -$8,866 | -$8,561 |
| Long Term Debt (MM) | $6,247 | $7,365 | $7,609 | $10,572 | $11,165 |
| LT Debt to Equity | 0.58 | 0.76 | 0.83 | 1.56 | 1.44 |