We've been asking ourselves recently if the market has placed a fair valuation on General Dynamics. Let's dive into some of the fundamental values of this large-cap Industrials company to determine if there might be an opportunity here for value-minded investors.
General Dynamics's Valuation Is in Line With Its Sector Averages:
General Dynamics Corporation operates as an aerospace and defense company worldwide. The company belongs to the Industrials sector, which has an average price to earnings (P/E) ratio of 20.49 and an average price to book (P/B) ratio of 3.78. In contrast, General Dynamics has a trailing 12 month P/E ratio of 19.7 and a P/B ratio of 3.37.
General Dynamics's PEG ratio is 1.78, which shows that the stock is probably overvalued in terms of its estimated growth. For reference, a PEG ratio near or below 1 is a potential signal that a company is undervalued.
A Pattern of Improving Cash Flows With a Flat Trend:
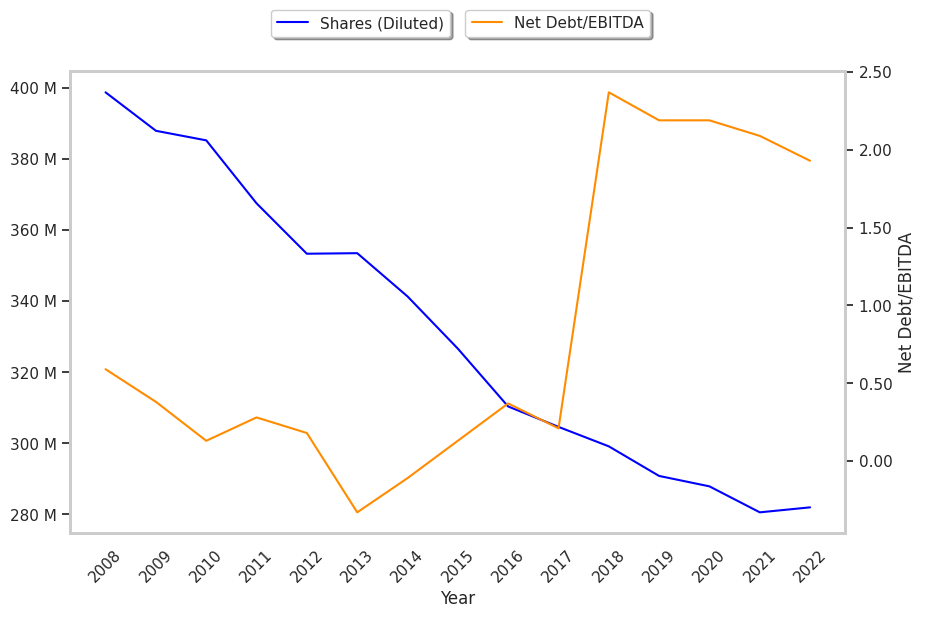
| 2018-02-12 | 2019-02-13 | 2020-02-10 | 2021-02-09 | 2022-02-09 | 2023-02-07 | |
|---|---|---|---|---|---|---|
| Revenue (MM) | $30,973 | $36,193 | $39,350 | $37,925 | $38,469 | $39,407 |
| Gross Margins | 20.0% | 18.0% | 18.0% | 17.0% | 17.0% | 17.0% |
| Operating Margins | 14% | 12% | 12% | 11% | 11% | 11% |
| Net Margins | 9.0% | 9.0% | 9.0% | 8.0% | 8.0% | 9.0% |
| Net Income (MM) | $2,912 | $3,345 | $3,484 | $3,167 | $3,257 | $3,390 |
| Net Interest Expense (MM) | -$103 | -$356 | -$460 | -$477 | -$424 | -$364 |
| Depreciation & Amort. (MM) | -$441 | -$436 | -$466 | -$523 | -$568 | -$586 |
| Earnings Per Share | $9.56 | $11.18 | $11.98 | $11.0 | $11.61 | $12.02 |
| EPS Growth | n/a | 16.95% | 7.16% | -8.18% | 5.55% | 3.53% |
| Diluted Shares (MM) | 305 | 299 | 291 | 288 | 281 | 282 |
| Free Cash Flow (MM) | $4,214 | $3,256 | $3,968 | $4,825 | $5,158 | $5,693 |
| Capital Expenditures (MM) | -$378 | -$128 | -$987 | -$967 | -$887 | -$1,114 |
| Net Current Assets (MM) | -$5,283 | -$15,487 | -$15,083 | -$14,104 | -$12,445 | -$11,954 |
| Long Term Debt (MM) | $3,980 | $11,444 | $9,010 | $9,995 | $10,490 | $9,243 |
| Net Debt / EBITDA | 0.21 | 2.37 | 2.19 | 2.19 | 2.09 | 1.93 |
General Dynamics has weak revenue growth and a flat capital expenditure trend, weak operating margings with a stable trend, and just enough current assets to cover current liabilities. In addition, we note significant leverage. We also note that the company benefits from a pattern of improving cash flows and positive EPS growth. However, the firm has slimmer gross margins than its peers.