Now trading at a price of $26.59, JD.com has moved -3.8% so far today.
JD.com returned losses of -40.0% last year, with its stock price reaching a high of $67.09 and a low of $26.36. Over the same period, the stock underperformed the S&P 500 index by -58.0%. As of April 2023, the company's 50-day average price was $32.13. JD.com, Inc. provides supply chain-based technologies and services in the People's Republic of China. Based in Beijing, China, the large-cap Consumer Discretionary company has 450,679 full time employees. JD.com has not offered a regular dividend during the last year.
The Company Trades Below Its Net Current Asset Value:
| 2017-05-01 | 2018-04-27 | 2019-04-15 | 2020-04-15 | 2021-04-28 | 2022-04-28 | |
|---|---|---|---|---|---|---|
| Revenue (MM) | $5,773 | $8,751 | $10,580 | $576,888 | $745,802 | $951,592 |
| Gross Margins | 64.0% | 63.0% | 60.0% | 15.0% | 15.0% | 14.0% |
| Operating Margins | -3% | -13% | -6% | 1% | 1% | 0% |
| Net Margins | -9.0% | -18.0% | -6.0% | 2.0% | 7.0% | 0.0% |
| Net Income (MM) | -$541 | -$1,611 | -$608 | $12,184 | $49,405 | -$3,560 |
| Net Interest Expense (MM) | -$11 | $0 | $47 | -$725 | -$1,125 | -$1,213 |
| Depreciation & Amort. (MM) | -$689 | -$4,193 | -$5,560,034 | -$5,828 | -$6,068 | -$6,232 |
| Earnings Per Share | -$0.39 | -$1.11 | -$0.42 | $8.21 | $15.89 | -$2.36 |
| EPS Growth | n/a | -184.62% | 62.16% | 2054.76% | 93.54% | -114.85% |
| Diluted Shares (MM) | 1,402 | 1,456 | 1,439 | 1,484 | 3,109 | 1,511 |
| Free Cash Flow (MM) | $1,066 | $34,945 | $34,891,977 | $28,458 | $47,451 | $53,946 |
| Capital Expenditures (MM) | -$541 | -$8,089 | -$14,010,555 | -$3,677 | -$4,907 | -$11,645 |
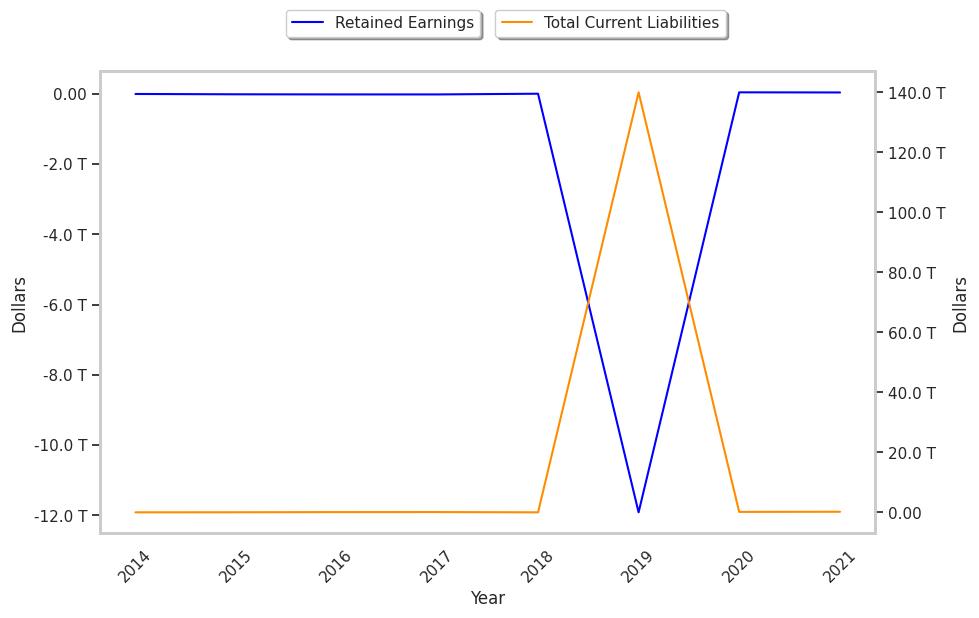
| Net Current Assets (MM) | -$12,222 | -$20,497 | -$5,465 | -$21,464,080 | $34,132 | $49,949 |
| Long Term Debt (MM) | $9,149 | $10,923 | $9,166 | $10,051,782 | $15,790 | $9,386 |
| Net Debt / EBITDA | -3.65 | -3.39 | 0.0 | -4710.41 | -7.81 | -17.86 |
JD.com has weak revenue growth and a flat capital expenditure trend, irregular cash flows, and just enough current assets to cover current liabilities. We also note that the company benefits from low leverage and wider gross margins than its peer group. However, the firm suffers from consistently negative margins with a stable trend and declining EPS growth.
JD.com Has Attractive P/B and P/E Ratios:
JD.com has a trailing twelve month P/E ratio of 17.7, compared to an average of 22.33 for the Consumer Discretionary sector. Based on its EPS guidance of $3.32, the company has a forward P/E ratio of 9.7. The company doesn't issue forward earnings guidance, and the compound average growth rate of its last 6 years of reported EPS is -35.0%. On this basis, the company's PEG ratio is -0.5, which indicates that its shares are overpriced. In contrast, the market is likely undervaluing JD.com in terms of its equity because its P/B ratio is 0.19 while the sector average is 3.12.
There's an Analyst Consensus of Strong Upside Potential for JD.com:
The 35 analysts following JD.com have set target prices ranging from $31.54 to $97.03 per share, for an average of $49.99 with a buy rating. As of April 2023, the company is trading -35.7% away from its average target price, indicating that there is an analyst consensus of strong upside potential.
The largest shareholder is Tiger Global Management, LLC, whose 2% stake in the company is worth $560,273,724.