Today we're going to take a closer look at large-cap Industrials company Keysight Technologies, whose shares are currently trading at $128.66. We've been asking ourselves whether the company is under or over valued at today's prices... let's perform a brief value analysis to find out!
Keysight Technologies's Valuation Is in Line With Its Sector Averages:
Keysight Technologies, Inc. provides electronic design and test solutions to commercial communications, networking, aerospace, defense and government, automotive, energy, semiconductor, electronic, and education industries in the Americas, Europe, and the Asia Pacific. The company belongs to the Industrials sector, which has an average price to earnings (P/E) ratio of 20.49 and an average price to book (P/B) ratio of 3.78. In contrast, Keysight Technologies has a trailing 12 month P/E ratio of 21.1 and a P/B ratio of 4.67.
Keysight Technologies's PEG ratio is 3.66, which shows that the stock is probably overvalued in terms of its estimated growth. For reference, a PEG ratio near or below 1 is a potential signal that a company is undervalued.
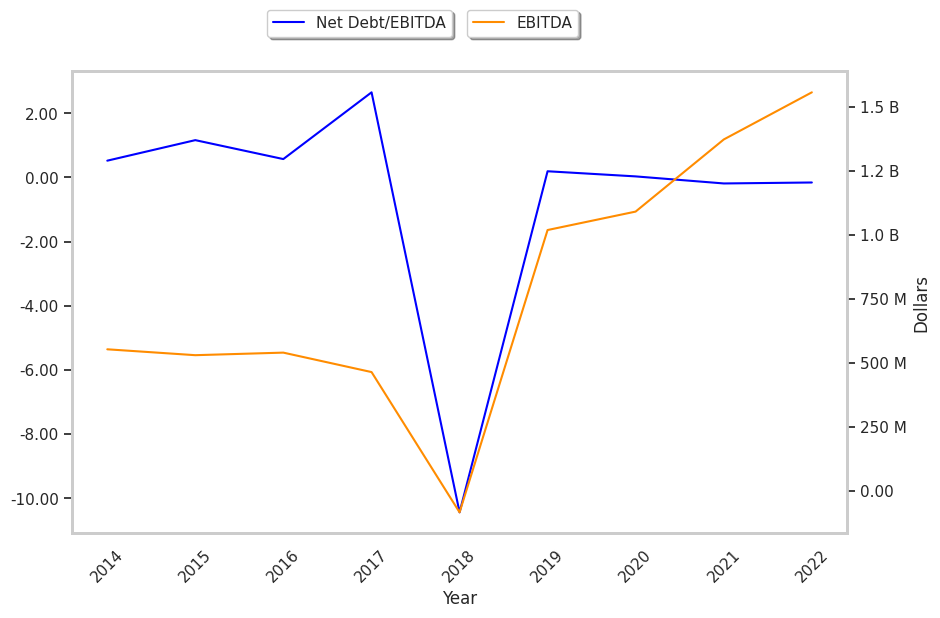
An Exceptionally Strong Balance Sheet:
| 2017-12-20 | 2018-12-18 | 2019-12-18 | 2020-12-17 | 2021-12-17 | 2022-12-15 | |
|---|---|---|---|---|---|---|
| Revenue (MM) | $3,189 | $3,878 | $4,303 | $4,221 | $4,941 | $5,420 |
| Gross Margins | 53.0% | 54.0% | 59.0% | 60.0% | 62.0% | 64.0% |
| Operating Margins | 7% | -10% | 17% | 18% | 22% | 25% |
| Net Margins | 3.0% | 4.0% | 14.0% | 15.0% | 18.0% | 21.0% |
| Net Income (MM) | $102 | $165 | $621 | $627 | $894 | $1,124 |
| Net Interest Expense (MM) | -$73 | -$71 | -$57 | -$67 | -$76 | -$63 |
| Depreciation & Amort. (MM) | -$225 | -$310 | -$308 | -$326 | -$293 | -$223 |
| Earnings Per Share | $0.56 | $0.86 | $3.25 | $3.32 | $4.78 | $6.01 |
| EPS Growth | n/a | 53.57% | 277.91% | 2.15% | 43.98% | 25.73% |
| Diluted Shares (MM) | 182 | 191 | 191 | 189 | 187 | 187 |
| Free Cash Flow (MM) | $392 | $658 | $1,118 | $1,133 | $1,496 | $1,329 |
| Capital Expenditures (MM) | -$64 | -$103 | -$120 | -$117 | -$174 | -$185 |
| Net Current Assets (MM) | -$1,446 | -$1,013 | -$404 | -$547 | -$163 | $297 |
| Long Term Debt (MM) | $2,038 | $1,291 | $1,788 | $1,789 | $1,791 | $1,793 |
Keysight Technologies has exceptional EPS growth and an excellent current ratio. Additionally, the company's financial statements display healthy debt levels and wider gross margins than its peer group. Furthermore, Keysight Technologies has weak revenue growth and a flat capital expenditure trend, average net margins with a positive growth rate, and irregular cash flows.