Cadence Design Systems logged a -2.3% change during today's afternoon session, and is now trading at a price of $234.44 per share.
Cadence Design Systems returned gains of 55.0% last year, with its stock price reaching a high of $255.85 and a low of $138.76. Over the same period, the stock outperformed the S&P 500 index by 45.0%. More recently, the company's 50-day average price was $237.14. Cadence Design Systems, Inc. provides software, hardware, services, and reusable integrated circuit (IC) design blocks worldwide. Based in San Jose, CA, the large-cap Technology company has 10,200 full time employees. Cadence Design Systems has not offered a dividend during the last year.
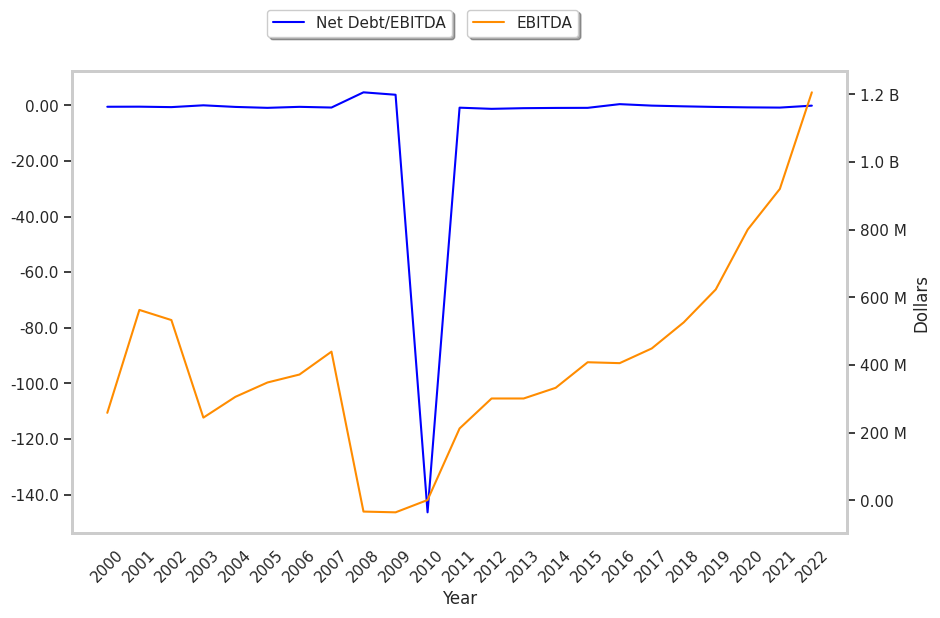
Healthy Debt Levels and Exceptional EPS Growth:
| 2018-02-20 | 2019-02-27 | 2020-02-24 | 2021-02-22 | 2022-02-22 | 2023-02-13 | |
|---|---|---|---|---|---|---|
| Revenue (MM) | $1,943 | $2,138 | $2,336 | $2,683 | $2,988 | $3,562 |
| Operating Margins | 17% | 19% | 21% | 24% | 26% | 30% |
| Net Margins | 11.0% | 16.0% | 42.0% | 22.0% | 23.0% | 24.0% |
| Net Income (MM) | $204 | $346 | $989 | $591 | $696 | $849 |
| Net Interest Expense (MM) | -$26 | -$23 | -$19 | -$21 | -$17 | -$23 |
| Depreciation & Amort. (MM) | -$116 | -$119 | -$123 | -$146 | -$142 | -$132 |
| Earnings Per Share | $0.73 | $1.23 | $3.53 | $2.11 | $2.5 | $3.09 |
| EPS Growth | n/a | 68.49% | 186.99% | -40.23% | 18.48% | 23.6% |
| Diluted Shares (MM) | 280 | 281 | 281 | 280 | 278 | 275 |
| Free Cash Flow (MM) | $529 | $666 | $804 | $1,000 | $1,168 | $1,366 |
| Capital Expenditures (MM) | -$58 | -$62 | -$75 | -$95 | -$67 | -$124 |
| Net Current Assets (MM) | -$450 | -$229 | -$85 | $21 | $70 | -$685 |
| Long Term Debt (MM) | $644 | $345 | $346 | $347 | $348 | $748 |
Cadence Design Systems has exceptional EPS growth and a pattern of improving cash flows. Additionally, the company's financial statements display healthy debt levels and average operating margins with a positive growth rate. Furthermore, Cadence Design Systems has weak revenue growth and a flat capital expenditure trend and just enough current assets to cover current liabilities.
The Market May Be Overvaluing Cadence Design Systems's Earnings and Assets:
Cadence Design Systems has a trailing twelve month P/E ratio of 72.7, compared to an average of 27.16 for the Technology sector. Based on its EPS guidance of $5.85, the company has a forward P/E ratio of 40.5. Cadence Design Systems's PEG ratio is 6.81 on the basis of the 10.7% weighted average of the company and the broader market's EPS compound average growth rates. This suggests that the company's shares are overvalued. Furthermore, Cadence Design Systems is likely overvalued compared to the book value of its equity, since its P/B ratio of 21.91 is higher than the sector average of 6.23. The company's shares are currently trading 790.0% above their Graham number. Overall, Cadence Design Systems's lofty valuation in terms of earnings and assets is to some extent attenuated by its strong cash flow trend and reasonable levels of debt.
Cadence Design Systems Has an Average Rating of Buy:
The 14 analysts following Cadence Design Systems have set target prices ranging from $240.0 to $307.0 per share, for an average of $270.86 with a buy rating. As of April 2023, the company is trading -12.4% away from its average target price, indicating that there is an analyst consensus of some upside potential.
Cadence Design Systems has a very low short interest because 1.3% of the company's shares are sold short. Institutions own 92.2% of the company's shares, and the insider ownership rate stands at 0.93%, suggesting a small amount of insider investors. The largest shareholder is Blackrock Inc., whose 11% stake in the company is worth $7,049,002,056.