Now trading at a price of $56.9, Equity Residential has moved 1.0% so far today.
Equity Residential returned losses of -13.0% last year, with its stock price reaching a high of $69.45 and a low of $54.6. Over the same period, the stock underperformed the S&P 500 index by -24.0%. As of April 2023, the company's 50-day average price was $61.53. Equity Residential is committed to creating communities where people thrive. Based in Chicago, IL, the large-cap Real Estate company has 2,400 full time employees. Equity Residential has offered a 4.6% dividend yield over the last 12 months.
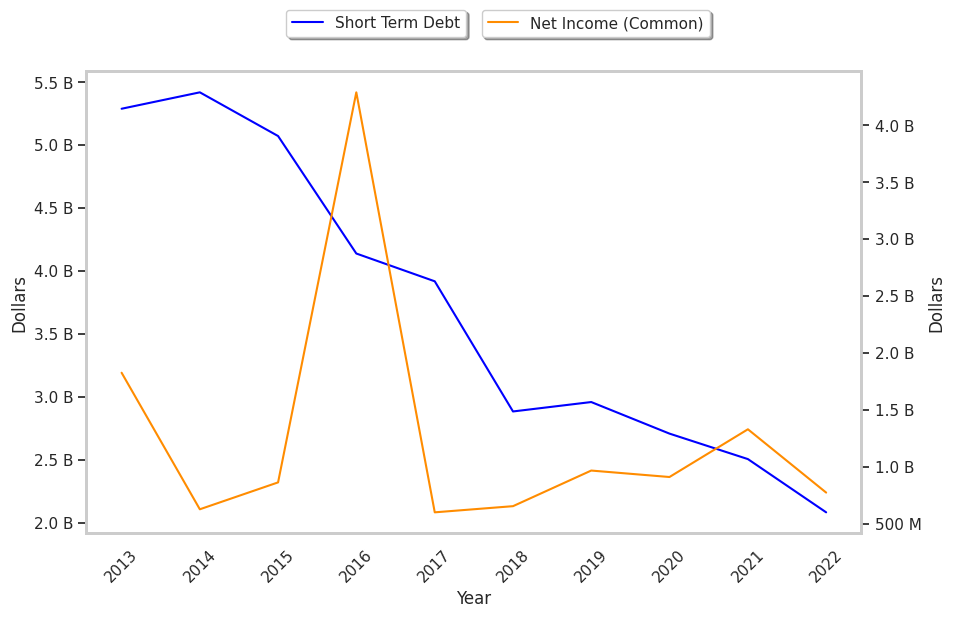
Exceptional Profitability Overshadowed by Excessive Leverage:
| 2018-02-22 | 2019-02-21 | 2020-02-20 | 2021-02-18 | 2022-02-17 | 2023-02-16 | |
|---|---|---|---|---|---|---|
| Revenue (MM) | $2,471 | $2,578 | $2,701 | $2,572 | $2,464 | $2,735 |
| Operating Margins | 34% | 33% | 34% | 31% | 25% | 30% |
| Net Margins | 24.0% | 26.0% | 36.0% | 36.0% | 54.0% | 28.0% |
| Net Income (MM) | $603 | $658 | $970 | $914 | $1,333 | $777 |
| Net Interest Expense (MM) | -$384 | -$413 | -$390 | -$365 | -$272 | -$283 |
| Depreciation & Amort. (MM) | -$744 | -$786 | -$831 | -$821 | -$838 | -$882 |
| Earnings Per Share | $1.57 | $1.71 | $2.5 | $2.36 | $3.42 | $1.99 |
| EPS Growth | n/a | 8.92% | 46.2% | -5.6% | 44.92% | -41.81% |
| Diluted Shares (MM) | 383 | 384 | 386 | 386 | 388 | 388 |
| Free Cash Flow (MM) | $1,773 | $1,710 | $1,843 | $1,422 | $1,413 | $1,680 |
| Capital Expenditures (MM) | -$507 | -$354 | -$386 | -$156 | -$153 | -$225 |
| Net Current Assets (MM) | -$9,629 | -$9,499 | -$10,048 | -$9,085 | -$9,359 | -$8,463 |
| Long Term Debt (MM) | $5,039 | $5,933 | $6,078 | $5,336 | $5,835 | $5,342 |
| Net Debt / EBITDA | 5.59 | 5.33 | 5.17 | 4.98 | 5.63 | 4.35 |
Equity Residential's Valuation Is in Line With Its Sector Averages:
Equity Residential has a trailing twelve month P/E ratio of 28.9, compared to an average of 24.81 for the Real Estate sector. Based on its EPS guidance of $1.68, the company has a forward P/E ratio of 36.6. The company doesn't issue forward earnings guidance, and the compound average growth rate of its last 6 years of reported EPS is 4.0%. On this basis, the company's PEG ratio is 7.17, which suggests that it is overpriced. In contrast, the market is likely undervaluing Equity Residential in terms of its equity because its P/B ratio is 1.96 while the sector average is 2.24. The company's shares are currently trading 54.9% above their Graham number.
Equity Residential Has an Average Rating of Hold:
The 19 analysts following Equity Residential have set target prices ranging from $62.0 to $95.0 per share, for an average of $70.11 with a hold rating. As of April 2023, the company is trading -12.2% away from its average target price, indicating that there is an analyst consensus of some upside potential.
Equity Residential has an average amount of shares sold short because 2.2% of the company's shares are sold short. Institutions own 92.6% of the company's shares, and the insider ownership rate stands at 1.71%, suggesting a large amount of insider shareholders. The largest shareholder is Vanguard Group Inc, whose 15% stake in the company is worth $3,244,358,430.