General Motors Company shares fell by -2.3% during the day's afternoon session, and are now trading at a price of $28.55. Is it time to buy the dip? To better answer that question, it's essential to check if the market is valuing the company's shares fairly in terms of its earnings and equity levels.
General Motors Company Is Potentially Undervalued and Trades Below Its Graham Number:
General Motors Company designs, builds, and sells trucks, crossovers, cars, and automobile parts; and provide software-enabled services and subscriptions worldwide. The company belongs to the Consumer Discretionary sector, which has an average price to earnings (P/E) ratio of 22.33 and an average price to book (P/B) ratio of 3.12. In contrast, General Motors Company has a trailing 12 month P/E ratio of 4.0 and a P/B ratio of 0.56.
When we divideGeneral Motors Company's P/E ratio by its expected five-year EPS growth rate, we obtain a PEG ratio of 0.83, which indicates that the market is undervaluing the company's projected growth (a PEG ratio of 1 indicates a fairly valued company). Your analysis of the stock shouldn't end here. Rather, a good PEG ratio should alert you that it may be worthwhile to take a closer look at the stock.
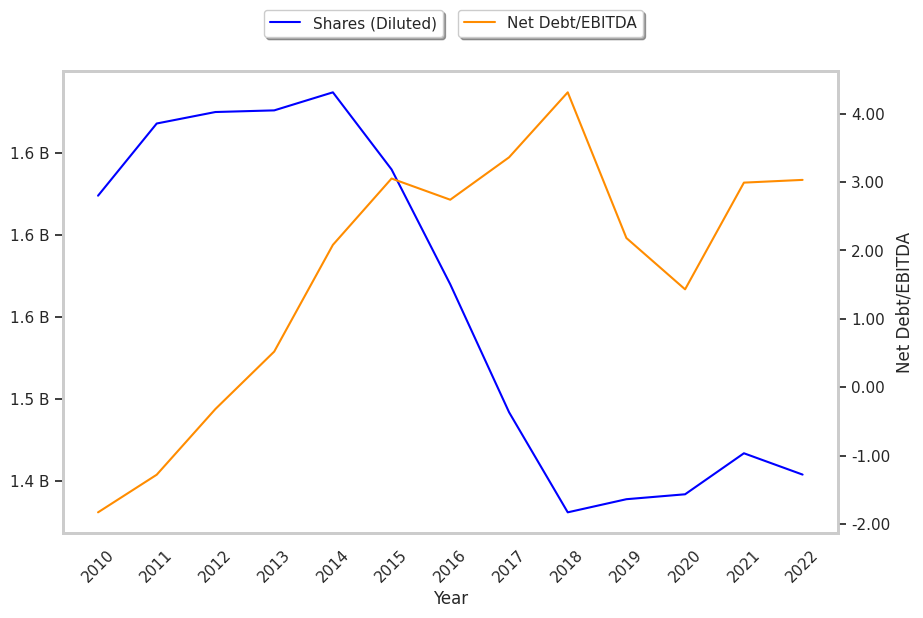
Exceptional EPS Growth at the Expense of a Highly Leveraged Balance Sheet:
| 2018-02-06 | 2019-02-06 | 2020-02-05 | 2021-02-10 | 2022-02-02 | 2023-01-31 | |
|---|---|---|---|---|---|---|
| Revenue (MM) | $145,588 | $147,049 | $137,237 | $122,485 | $127,004 | $156,735 |
| Gross Margins | 13.0% | 10.0% | 10.0% | 20.0% | 21.0% | 19.0% |
| Operating Margins | 6% | 3% | 4% | 5% | 7% | 7% |
| Net Margins | -3.0% | 5.0% | 5.0% | 5.0% | 8.0% | 6.0% |
| Net Income (MM) | -$3,864 | $8,014 | $6,732 | $6,427 | $10,019 | $9,934 |
| Net Interest Expense (MM) | -$575 | -$655 | -$782 | -$1,098 | -$950 | -$987 |
| Depreciation & Amort. (MM) | -$12,261 | -$13,669 | -$14,118 | -$12,815 | -$12,051 | -$11,290 |
| Earnings Per Share | -$2.6 | $5.53 | $4.57 | $4.46 | $6.83 | $6.83 |
| EPS Growth | n/a | 312.69% | -17.36% | -2.41% | 53.14% | 0.0% |
| Diluted Shares (MM) | 1,492 | 1,431 | 1,439 | 1,442 | 1,467 | 1,454 |
| Free Cash Flow (MM) | $38,294 | $29,889 | $25,715 | $23,804 | $22,906 | $22,995 |
| Capital Expenditures (MM) | -$20,966 | -$14,633 | -$10,694 | -$7,134 | -$7,718 | -$6,953 |
| Net Current Assets (MM) | -$107,538 | -$109,269 | -$107,088 | -$104,593 | -$96,800 | -$91,303 |
| Long Term Debt (MM) | $67,254 | $73,060 | $65,924 | $56,788 | $59,304 | $60,036 |
| Net Debt / EBITDA | 3.36 | 4.31 | 2.18 | 1.43 | 2.99 | 3.03 |
General Motors Company has weak revenue growth and a flat capital expenditure trend, average net margins with a stable trend, and irregular cash flows. In addition, we note just enough current assets to cover current liabilities. We also note that the company has exceptional EPS growth working in its favor. However, the firm suffers from slimmer gross margins than its peers and a highly leveraged balance sheet.