Chevron logged a -0.4% change during today's afternoon session, and is now trading at a price of $156.04 per share.
Chevron returned losses of -10.0% last year, with its stock price reaching a high of $189.68 and a low of $149.74. Over the same period, the stock underperformed the S&P 500 index by -20.0%. As of April 2023, the company's 50-day average price was $164.28. Chevron Corporation, through its subsidiaries, engages in the integrated energy and chemicals operations in the United States and internationally. Based in San Ramon, CA, the large-cap Energy company has 43,846 full time employees. Chevron has offered a 3.7% dividend yield over the last 12 months.
Growing Revenues With a Flat Capital Expenditure Trend:
| 2018 | 2019 | 2020 | 2021 | 2022 | 2023 | |
|---|---|---|---|---|---|---|
| Revenue (MM) | $166,339 | $146,516 | $94,692 | $162,465 | $246,252 | $222,806 |
| Gross Margins | 12% | 4% | -8% | 13% | 20% | 19% |
| Operating Margins | 12.0% | 4.0% | -8.0% | 13.0% | 20.0% | 19.0% |
| Net Margins | 9.0% | 2.0% | 0.0% | 10.0% | 14.0% | 14.0% |
| Net Income (MM) | $14,860 | $2,924 | -$18 | $15,689 | $35,608 | $30,229 |
| Net Interest Expense (MM) | $748 | $798 | $697 | $712 | $516 | $486 |
| Depreciation & Amort. (MM) | $19,419 | $29,218 | $19,508 | $17,925 | $16,319 | $16,012 |
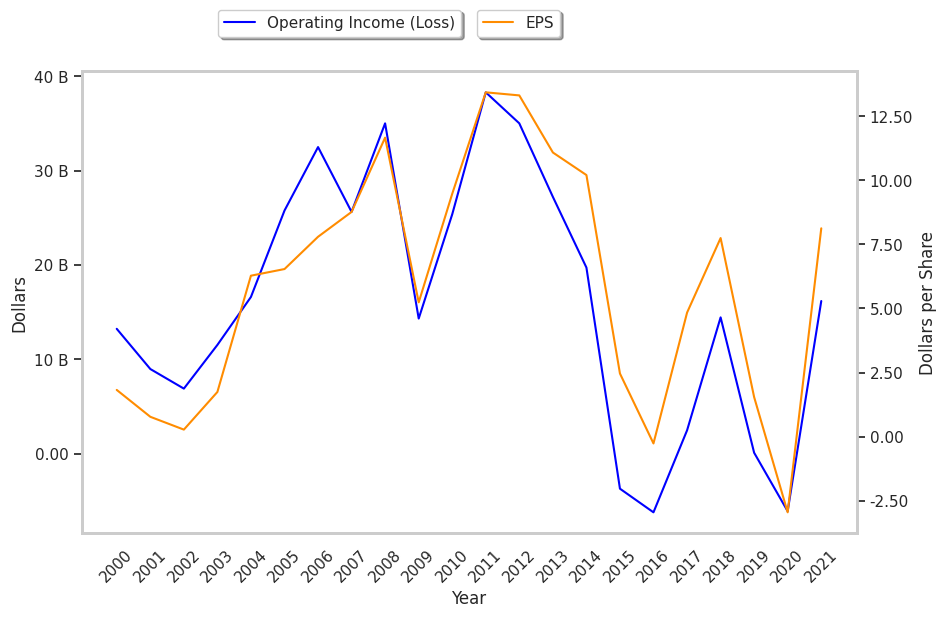
| Earnings Per Share | $7.74 | $1.54 | -$2.96 | $8.14 | $18.28 | $15.77 |
| EPS Growth | n/a | -80.1% | -292.21% | 375.0% | 124.57% | -13.73% |
| Diluted Shares (MM) | 1,914 | 1,895 | 1,870 | 1,920 | 1,940 | 1,815 |
| Free Cash Flow (MM) | $16,826 | $13,198 | $1,655 | $21,131 | $37,628 | $27,642 |
| Capital Expenditures (MM) | $13,792 | $14,116 | $8,922 | $8,056 | $11,974 | $13,625 |
| Net Current Assets (MM) | -$64,200 | -$63,891 | -$80,986 | -$65,857 | -$47,124 | -$49,691 |
| Long Term Debt (MM) | $40,823 | $37,246 | $55,529 | $46,879 | $37,687 | $41,773 |
| Net Debt / EBITDA | 0.9 | 0.97 | 4.19 | 1.03 | 0.31 | 0.58 |
Chevron has growing revenues and a flat capital expenditure trend, low leverage, and a strong EPS growth trend. However, the firm suffers from slimmer gross margins than its peers and weak operating margins with a positive growth rate. Finally, we note that Chevron has irregular cash flows.
Chevron's Valuation Is in Line With Its Sector Averages:
Chevron has a trailing twelve month P/E ratio of 10.4, compared to an average of 7.54 for the Energy sector. Based on its EPS guidance of $13.97, the company has a forward P/E ratio of 11.8. The company doesn't provide forward earnings guidance, and the compound average growth rate of its last 6 years of reported EPS is 12.6%. On this basis, Chevron's PEG ratio is 0.83. Using instead the 9.1% weighted average of Chevron's earnings CAGR and the broader market's anticipated 5-year EPS growth rate, the company's PEG ratio is 1.14, which shows that its shares might be fairly priced. The market is placing a fair value on Chevron's equity, since its P/B ratio of 1.84 is comparable to its sector average of 1.68. The company's shares are currently trading -11.5% below their Graham number. In conclusion, Chevron's impressive cash flow trend, decent P/B ratio, and reasonable use of leverage demonstrate that the company may still be fairly valued — despite its elevated earnings multiple.
Analysts Give Chevron an Average Rating of Buy:
The 26 analysts following Chevron have set target prices ranging from $160.33 to $202.77 per share, for an average of $178.17 with a buy rating. As of April 2023, the company is trading -7.8% away from its average target price, indicating that there is an analyst consensus of some upside potential.
Chevron has a very low short interest because 0.8% of the company's shares are sold short. Institutions own 72.6% of the company's shares, and the insider ownership rate stands at 0.04%, suggesting a small amount of insider investors. The largest shareholder is Vanguard Group Inc, whose 9% stake in the company is worth $25,195,199,587.