Now trading at a price of $257.91, McDonald's has moved 0.2% so far today.
Over the last year, McDonald's logged a 2.0% change, with its stock price reaching a high of $299.35 and a low of $245.73. Over the same period, the stock underperformed the S&P 500 index by -9.0%. As of April 2023, the company's 50-day average price was $269.7. McDonald's Corporation operates and franchises McDonald's restaurants in the United States and internationally. Based in Chicago, IL, the large-cap Consumer Discretionary company has 100,000 full time employees. McDonald's has offered a 2.3% dividend yield over the last 12 months.
The Company's Revenues Are Declining:
| 2018 | 2019 | 2020 | 2021 | 2022 | 2023 | |
|---|---|---|---|---|---|---|
| Revenue (MM) | $21,258 | $21,364 | $19,208 | $23,223 | $23,183 | $24,194 |
| Gross Margins | 42% | 42% | 38% | 45% | 40% | 45% |
| Operating Margins | 42.0% | 42.0% | 38.0% | 45.0% | 40.0% | 45.0% |
| Net Margins | 28.0% | 28.0% | 25.0% | 32.0% | 27.0% | 33.0% |
| Net Income (MM) | $5,924 | $6,025 | $4,730 | $7,545 | $6,177 | $7,998 |
| Net Interest Expense (MM) | $981 | $1,122 | $1,218 | $1,186 | $1,207 | $1,289 |
| Depreciation & Amort. (MM) | $1,482 | $1,618 | $1,751 | $1,868 | $1,871 | $1,911 |
| Earnings Per Share | $7.54 | $7.88 | $6.31 | $10.04 | $8.33 | $10.85 |
| EPS Growth | n/a | 4.51% | -19.92% | 59.11% | -17.03% | 30.25% |
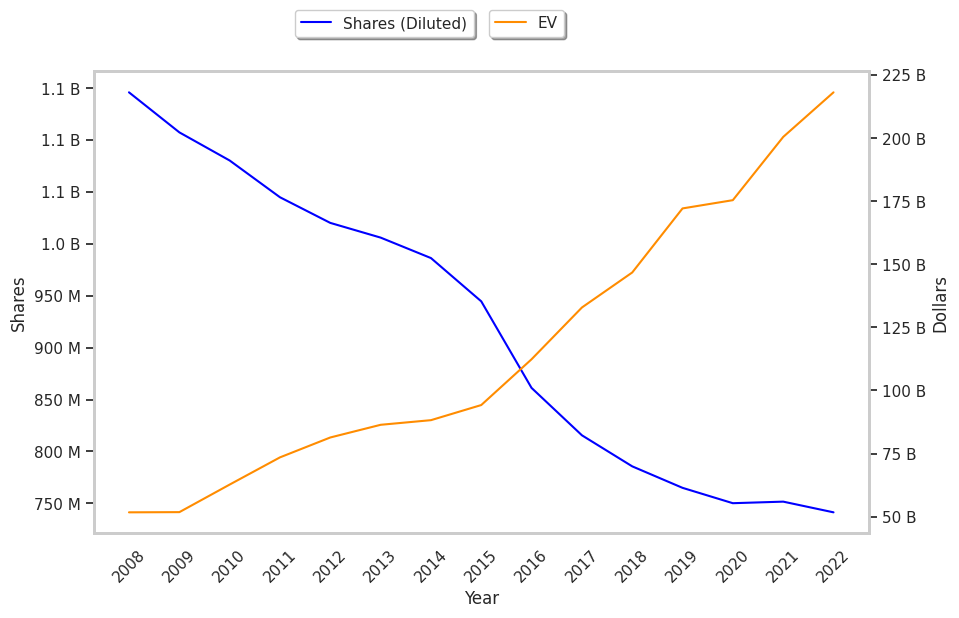
| Diluted Shares (MM) | 786 | 765 | 750 | 752 | 741 | 722 |
| Free Cash Flow (MM) | $4,225 | $5,728 | $4,624 | $7,102 | $5,488 | $6,639 |
| Capital Expenditures (MM) | $2,742 | $2,394 | $1,641 | $2,040 | $1,899 | $2,090 |
| Net Current Assets (MM) | -$4,807 | -$6,235 | -$5,636 | -$2,484 | -$2,686 | -$1,645 |
| Long Term Debt (MM) | $31,075 | $34,118 | $35,197 | $35,623 | $35,904 | $35,710 |
| Net Debt / EBITDA | 3.06 | 3.24 | 3.91 | 2.57 | 3.01 | 2.76 |
McDonald's has wider gross margins than its peer group, decent operating margins with a stable trend, and positive EPS growth. However, the firm suffers from weak revenue growth and decreasing reinvestment in the business and a highly leveraged balance sheet. Finally, we note that McDonald's has irregular cash flows.
McDonald's's Valuation Is in Line With Its Sector Averages:
McDonald's has a trailing twelve month P/E ratio of 24.8, compared to an average of 22.33 for the Consumer Discretionary sector. Based on its EPS guidance of $11.7, the company has a forward P/E ratio of 23.1. The company doesn't issue forward earnings guidance, and the compound average growth rate of its last 6 years of reported EPS is 6.3%. On this basis, the company's PEG ratio is 3.97, which suggests that it is overpriced.
Analysts Give McDonald's an Average Rating of Buy:
The 34 analysts following McDonald's have set target prices ranging from $254.64 to $361.21 per share, for an average of $300.26 with a buy rating. As of April 2023, the company is trading -10.2% away from its average target price, indicating that there is an analyst consensus of some upside potential.
McDonald's has a very low short interest because 1.0% of the company's shares are sold short. Institutions own 70.4% of the company's shares, and the insider ownership rate stands at 0.21%, suggesting a small amount of insider investors. The largest shareholder is Vanguard Group Inc, whose 9% stake in the company is worth $17,586,217,226.