Now trading at a price of $185.0, Align Technology has moved -3.1% so far today.
Over the last year, Align Technology logged a -5.0% change, with its stock price reaching a high of $413.2 and a low of $172.05. Over the same period, the stock underperformed the S&P 500 index by -14.0%. As of April 2023, the company's 50-day average price was $308.59. Align Technology, Inc. designs, manufactures, and markets Invisalign clear aligners, and iTero intraoral scanners and services for orthodontists and general practitioner dentists in the United States, Switzerland, China, and internationally. Based in Tempe, AZ, the large-cap Health Care company has 23,165 full time employees. Align Technology has not offered a dividend during the last year.
Increasing Revenues but Narrowing Margins:
| 2018 | 2019 | 2020 | 2021 | 2022 | 2023 | |
|---|---|---|---|---|---|---|
| Revenue (MM) | $1,966 | $2,407 | $2,472 | $3,953 | $3,735 | $3,737 |
| Gross Margins | 74% | 72% | 71% | 74% | 71% | 70% |
| Operating Margins | 24.0% | 23.0% | 16.0% | 26.0% | 17.0% | 15.0% |
| Net Margins | 20.0% | 18.0% | 72.0% | 20.0% | 10.0% | 8.0% |
| Net Income (MM) | $400 | $443 | $1,776 | $772 | $362 | $314 |
| Net Interest Expense (MM) | $9 | $12 | $3 | $33 | $5 | $11 |
| Depreciation & Amort. (MM) | $55 | $79 | $94 | $109 | $126 | $138 |
| Earnings Per Share | $4.92 | $5.53 | $22.41 | $9.69 | $4.61 | $4.07 |
| EPS Growth | n/a | 12.4% | 305.24% | -56.76% | -52.43% | -11.71% |
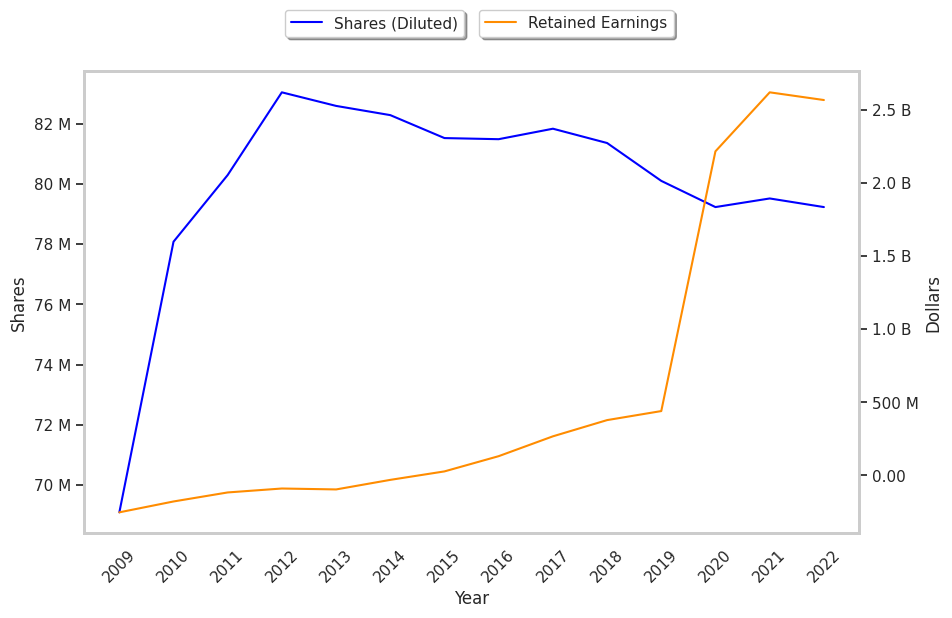
| Diluted Shares (MM) | 81 | 80 | 79 | 80 | 78 | 74 |
| Free Cash Flow (MM) | $331 | $747 | $662 | $771 | $277 | $612 |
| Capital Expenditures (MM) | $223 | n/a | n/a | $401 | $292 | $251 |
| Net Current Assets (MM) | $503 | $479 | $254 | $175 | $78 | -$41 |
| Long Term Debt (MM) | $13 | $82 | $0 | $0 | $0 | $0 |
| Net Debt / EBITDA | -1.2 | -0.73 | -2.0 | -0.98 | -1.23 | -1.36 |
Align Technology has growing revenues and a flat capital expenditure trend and low leverage. Additionally, the company's financial statements display wider gross margins than its peer group and decent operating margins with a negative growth trend. However, the firm has declining EPS growth. Finally, we note that Align Technology has irregular cash flows.
Align Technology's Valuation Is in Line With Its Sector Averages:
Align Technology has a trailing twelve month P/E ratio of 65.5, compared to an average of 24.45 for the Health Care sector. Based on its EPS guidance of $10.38, the company has a forward P/E ratio of 29.7. The company doesn't issue forward earnings guidance, and the compound average growth rate of its last 6 years of reported EPS is -3.1%. On this basis, the company's PEG ratio is -21.06, which indicates that its shares are overpriced. In contrast, the market is likely undervaluing Align Technology in terms of its equity because its P/B ratio is 3.73 while the sector average is 4.16. The company's shares are currently trading 176.6% above their Graham number. In conclusion, Align Technology's impressive cash flow trend, decent P/B ratio, and reasonable use of leverage demonstrate that the company may still be fairly valued — despite its elevated earnings multiple.
Align Technology Has an Average Rating of Buy:
The 12 analysts following Align Technology have set target prices ranging from $270.0 to $450.0 per share, for an average of $385.0 with a buy rating. As of April 2023, the company is trading -19.8% away from its average target price, indicating that there is an analyst consensus of strong upside potential.
Align Technology has an average amount of shares sold short because 3.5% of the company's shares are sold short. Institutions own 91.5% of the company's shares, and the insider ownership rate stands at 6.49%, suggesting a large amount of insider shareholders. The largest shareholder is Vanguard Group Inc, whose 11% stake in the company is worth $1,528,317,930.