Standing out among the Street's worst performers today is Moderna, a biotechnology company whose shares slumped -6.5% to a price of $71.23, 57.51% below its average analyst target price of $167.65.
The average analyst rating for the stock is buy. MRNA lagged the S&P 500 index by -9.0% so far today and by -69.0% over the last year, returning -52.0%.
Moderna, Inc., a biotechnology company, discovers, develops, and commercializes messenger RNA therapeutics and vaccines for the treatment of infectious diseases, immuno-oncology, rare diseases, autoimmune, and cardiovascular diseases in the United States, Europe, and internationally. The company is part of the healthcare sector. Healthcare companies work in incredibly complex markets, and their valuations can change in an instant based on a denied drug approval, a research and development breakthrough at a competitor, or a new government regulation. In the longer term, healthcare companies are affected by factors as varied as demographics and epidemiology. Investors who want to understand the healthcare market should be prepared for deep dives into a wide range of topics.
Moderna has a trailing 12 month P/E of 24.7. Unlike its trailing EPS of $2.88, the company's forward EPS is negative at $-5.14 so they do not publish a forward P/E ratio. Calculating it ourselves, we see that MRNA has a forward P/E ratio of -13.9.
The P/E ratio is the company's share price divided by its earnings per share. In other words, it represents how much investors are willing to spend for each dollar of the company's earnings (revenues minus the cost of goods sold, taxes, and overhead). As of the first quarter of 2023, the health care sector has an average P/E ratio of 24.45, and the average for the S&P 500 is 15.97.
A significant limitation with the price to earnings analysis is that it doesn’t account for investors’ growth expectations in the company. For example, a company with a low P/E ratio may not actually be a good value if it has little growth potential. Conversely, companies with high P/E ratios may be fairly valued in terms of growth expectations.
When we divide Moderna's P/E ratio by its projected 5 year earnings growth rate, we see that it has a Price to Earnings Growth (PEG) ratio of 0.42. This tells us that the company is largely undervalued in terms of growth expectations -- but remember, these growth expectations could turn out to be wrong!
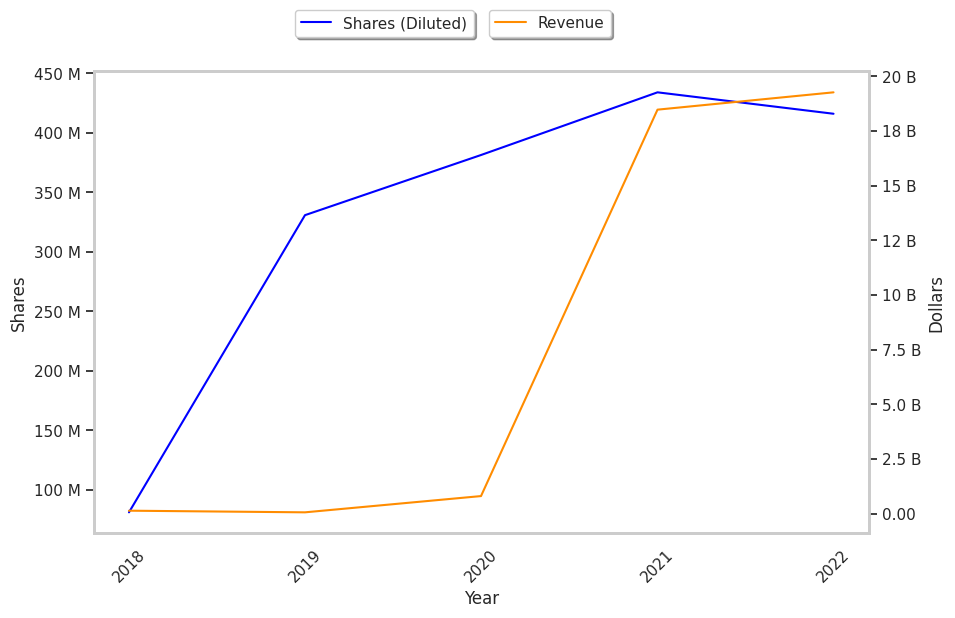
To understand the company's long term profitability and market position, we can analyze its operating margins, which are the ratio of its net profits to its revenues. Over the last four years, Moderna's operating margins have averaged -184.3% and displayed a mean growth rate of 0.4%. These numbers show that the company may not be on the best track.
When we subtract capital expenditures from operating cash flows, we are left with the company's free cash flow, which for Moderna was $-754000000 as of its last annual report. Free cash flow represents the amount of money available for reinvestment in the business or for payments to equity investors in the form of a dividend. In MRNA's case the cash flow outlook is weak. It's average cash flow over the last 4 years has been $3.03 Billion and they've been growing at an average rate of -9.5%.
Another valuation metric for analyzing a stock is its Price to Book (P/B) Ratio, which consists in its share price divided by its book value per share. The book value refers to the present liquidation value of the company, as if it sold all of its assets and paid off all debts). Moderna's P/B ratio indicates that the market value of the company exceeds its book value by a factor of 1.6, but is still below the average P/B ratio of the Health Care sector, which stood at 4.16 as of the first quarter of 2023.
Moderna is likely fairly valued at today's prices because it has an average P/E ratio, a lower P/B ratio than its sector average, and irregular cash flows with a downwards trend. The stock has poor growth indicators because of its consistently negative margins with a stable trend, and no PEG ratio. We hope this preliminary analysis will encourage you to do your own research into MRNA's fundamental values -- especially their trends over the last few years, which provide the clearest picture of the company's valuation.