Software company Cloudflare stunned Wall Street today as it surged to $56.68, marking a 3.1% change compared to the S&P 500 and the Nasdaq indices, which logged 1.0% and 1.0% respectively. NET is -19.18% below its average analyst target price of $70.13, which implies there is more upside for the stock. However, the average analayst rating for the stock is hold -- a more pessimistic outlook than you might expect. Over the last year, Cloudflare has underperfomed the S&P 500 by 3.0%, moving 13.0%.
CloudFlare, Inc. operates as a cloud services provider that delivers a range of services to businesses worldwide. The companyis in the technology sector, which groups together a wide range of industries including consumer electronics, software, computer hardware, scientific instruments and IT services. Legendary investor Warren Buffet once stated that he would never invest in technology companies. Apple is now one of his largest holdings.
The risks inherent to the technology sector are clear, but investors simply cannot ignore the potential for strong returns. Even with the lessons learnt in the 2000 tech bubble, the market continues to highly value the promise of technological innovation and the ability for these companies to build and occupy new markets.
Cloudflare does not release its trailing 12 month P/E ratio since its earnings per share of $-0.67 were negative over the last year. But we can calculate it ourselves, which gives us a trailing P/E ratio for NET of -84.6. Based on the company's positive earnings guidance of $0.45, the stock has a forward P/E ratio of 126.0. As of the first quarter of 2023, the average Price to Earnings (P/E) ratio of US technology companies is 27.16, and the S&P 500 average is 15.97. The P/E ratio consists in the stock's share price divided by its earnings per share (EPS), representing how much investors are willing to spend for each dollar of the company's earnings. Earnings are the company's revenues minus the cost of goods sold, overhead, and taxes.
Cloudflare's P/E ratio tells us how much investors are willing to pay for each dollar of the company's earnings. The problem with this metric is that it doesn't take into account the expected growth in earnings of the stock. Sometimes elevated P/E ratios can be justified by equally elevated growth expectations.
We can solve this inconsistency by dividing the company's trailing P/E ratio by its five year earnings growth estimate, which in this case gives us a 2.58 Price to Earnings Growth (PEG) ratio. Since the PEG ratio is greater than 1, the company's lofty valuation is not completely justified by its growth levels.
To better understand the strength of Cloudflare's business, we can analyse its operating margins, which are its revenues minus its operating costs. Consistently strong margins backed by a positive trend can signal that a company is on track to deliver returns for its shareholders. Here's the operating margin statistics for the last four years:
| Date Reported | Total Revenue ($ k) | Operating Expenses ($ k) | Operating Margins (%) | YoY Growth (%) |
|---|---|---|---|---|
| 2023 | 1,127,226 | 1,051,900 | -18 | 10.0 |
| 2022 | 975,241 | 943,834 | -20 | -5.26 |
| 2021 | 656,426 | 636,976 | -19 | 24.0 |
| 2020 | 431,059 | 436,772 | -25 | 30.56 |
| 2019 | 287,022 | 331,545 | -36 |
- Average operating margins: -23.6 %
- Average operating margins growth rate: 13.2 %
- Coefficient of variability (lower numbers indicate less volatility): 67.4 %
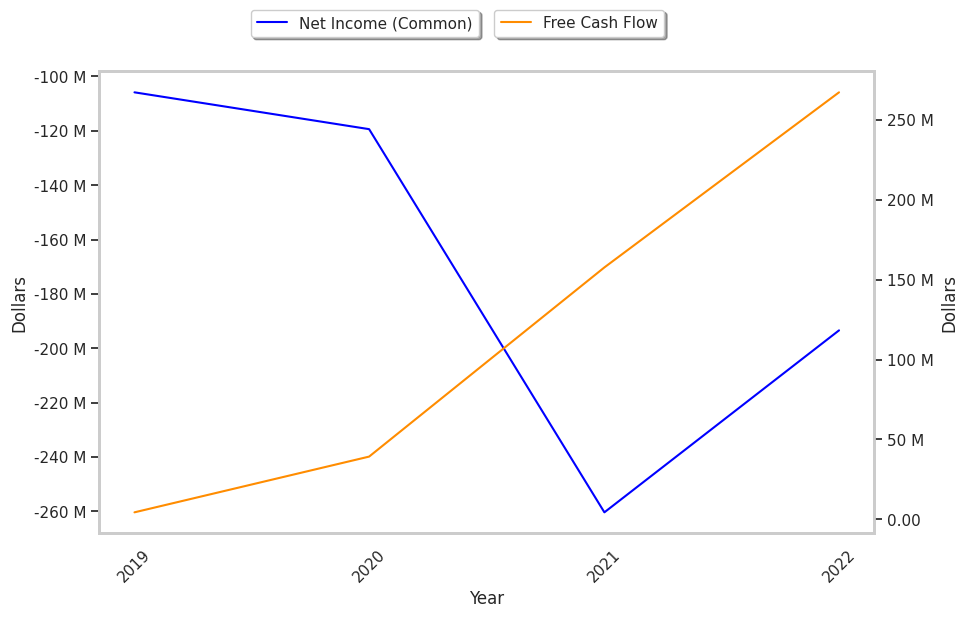
Cloudflare's financial viability can also be assessed through a review of its free cash flow trends. Free cash flow refers to its operating cash flows minues its capital expenditures, which are expenses related to the maintenance of fixed assets such as land, infrastructure, and equipment. Over the last four years, the trends have been as follows:
| Date Reported | Cash Flow from Operations ($ k) | Capital expenditures ($ k) | Free Cash Flow ($ k) | YoY Growth (%) |
|---|---|---|---|---|
| 2023 | 221,676 | 138,330 | 83,346 | 516.5 |
| 2022 | 123,595 | 143,606 | -20,011 | 29.38 |
| 2021 | 64,648 | 92,986 | -28,338 | 61.45 |
| 2020 | -17,129 | 56,375 | -73,504 | 10.59 |
| 2019 | -38,917 | 43,289 | -82,206 |
- Average free cash flow: $-24142600.0
- Average free cash flow growth rate: 15.0 %
- Coefficient of variability (lower numbers indicating more stability): 196.0 %
Free cash flows represents the amount of money that is available for reinvesting in the business, or paying out to investors in the form of a dividend. With a positive cash flow as of the last fiscal year, NET is in a position to do either -- which can encourage more investors to place their capital in the company.
Another valuation metric for analyzing a stock is its Price to Book (P/B) Ratio, which consists in its share price divided by its book value per share. The book value refers to the present liquidation value of the company, as if it sold all of its assets and paid off all debts. As of the first quarter of 2023, the average P/B ratio for technology companies is 6.23. In contrast, the average P/B ratio of the S&P 500 is 2.95. Cloudflare's P/B ratio indicates that the market value of the company exceeds its book value by a factor of 29.46, so it's likely that equity investors are over-valuing the company's assets.
Since it has a negative P/E ratio, an elevated P/B ratio, a pattern of improving cash flows on an upwards trend, Cloudflare is likely overvalued at today's prices. The company has mixed growth prospects because of a negative PEG ratio and consistently negative margins with a positive growth rate. We hope you enjoyed this basic overview of NET's fundamentals. Make sure to check the numbers for yourself, especially focusing on their trends over the last few years.