It's been a great afternoon session for Extra Space Storage investors, who saw their shares rise 1.9% to a price of $107.37 per share. At these higher prices, is the company still fairly valued? If you are thinking about investing, make sure to check the company's fundamentals before making a decision.
A Lower P/E Ratio Than Its Sector Average but Trades Above Its Graham Number:
Extra Space Storage Inc., headquartered in Salt Lake City, Utah, is a self-administered and self-managed REIT and a member of the S&P 500. The company belongs to the Real Estate sector, which has an average price to earnings (P/E) ratio of 24.81 and an average price to book (P/B) ratio of 2.24. In contrast, Extra Space Storage has a trailing 12 month P/E ratio of 17.5 and a P/B ratio of 4.45.
Extra Space Storage's PEG ratio is 3.97, which shows that the stock is probably overvalued in terms of its estimated growth. For reference, a PEG ratio near or below 1 is a potential signal that a company is undervalued.
Exceptional Profitability Overshadowed by Excessive Leverage:
| 2018 | 2019 | 2020 | 2021 | 2022 | 2023 | |
|---|---|---|---|---|---|---|
| Revenue (MM) | $1,197 | $1,308 | $1,356 | $1,577 | $1,924 | $2,020 |
| Operating Margins | 52.0% | 49.0% | 49.0% | 62.0% | 55.0% | 53.0% |
| Net Margins | 37.0% | 34.0% | 38.0% | 56.0% | 48.0% | 44.0% |
| Net Income (MM) | $447 | $451 | $518 | $878 | $921 | $880 |
| Earnings Per Share | $3.27 | $3.24 | $3.71 | $6.19 | $6.41 | $6.13 |
| Diluted Shares (MM) | 133 | 136 | 130 | 140 | 142 | 144 |
| Free Cash Flow (MM) | $617 | $654 | $704 | $896 | $1,176 | $1,157 |
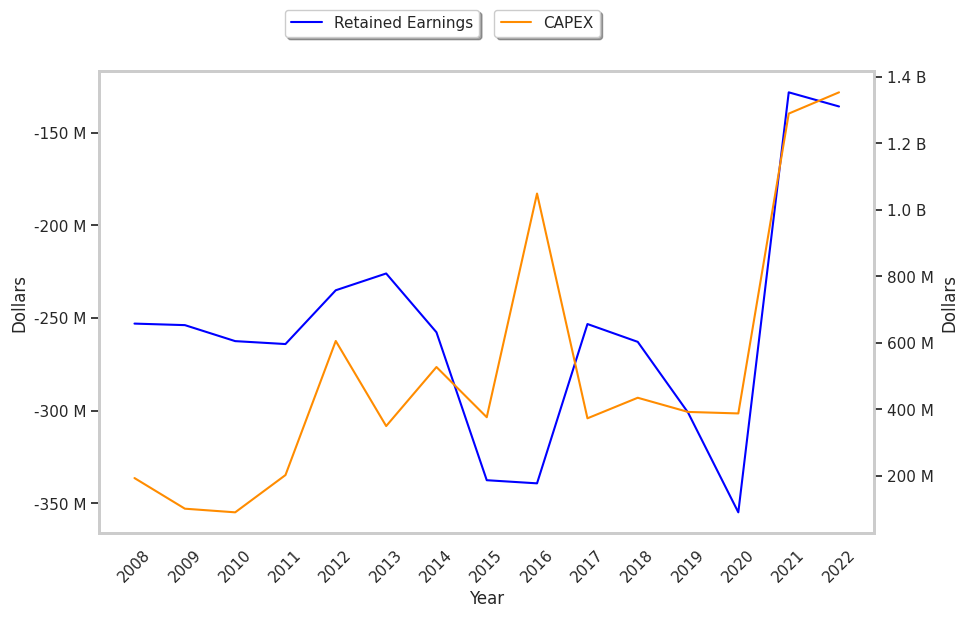
| Capital Expenditures (MM) | $61 | $54 | $67 | $56 | $62 | $70 |
| Net Current Assets (MM) | -$5,005 | -$5,545 | -$6,351 | -$6,617 | -$7,991 | -$8,277 |
| Long Term Debt (MM) | $5,042 | $5,587 | $6,432 | $6,658 | $8,057 | $8,330 |
| Net Debt / EBITDA | 11.01 | 11.51 | 12.49 | 6.49 | 6.91 | 5.98 |
Extra Space Storage has growing revenues and a flat capital expenditure trend and strong margins with a stable trend. Additionally, the company's financial statements display a strong EPS growth trend and generally positive cash flows. However, the firm has a highly leveraged balance sheet.