Today we're going to take a closer look at large-cap Telecommunications company AT&T, whose shares are currently trading at $15.87. We've been asking ourselves whether the company is under or over valued at today's prices... let's perform a brief value analysis to find out!
AT&T Has an Attractive P/B Ratio but a Worrisome P/E Ratio:
AT&T Inc. provides telecommunications and technology services worldwide. The company belongs to the Telecommunications sector, which has an average price to earnings (P/E) ratio of 18.85 and an average price to book (P/B) ratio of 3.12. In contrast, AT&T has a trailing 12 month P/E ratio of -10.5 and a P/B ratio of 1.09.
AT&T's PEG ratio is 14.67, which shows that the stock is probably overvalued in terms of its estimated growth. For reference, a PEG ratio near or below 1 is a potential signal that a company is undervalued.
The Company's Revenues Are Declining:
| 2018 | 2019 | 2020 | 2021 | 2022 | 2023 | |
|---|---|---|---|---|---|---|
| Revenue (MM) | $170,756 | $181,193 | $143,050 | $134,038 | $120,741 | $121,442 |
| Gross Margins | 15% | 15% | 6% | 19% | -4% | -2% |
| Operating Margins | 15.0% | 15.0% | 6.0% | 22.0% | -3.0% | -2.0% |
| Net Margins | 12.0% | 8.0% | 1.0% | 16.0% | 1.0% | 1.0% |
| Net Income (MM) | $19,953 | $14,975 | $1,355 | $21,479 | $1,469 | $1,233 |
| Net Interest Expense (MM) | $8,450 | $8,622 | $7,850 | $9,387 | $6,108 | $6,296 |
| Depreciation & Amort. (MM) | $28,430 | $28,217 | $22,523 | $17,852 | $18,021 | $18,415 |
| Earnings Per Share | $2.85 | $1.89 | -$0.75 | $2.73 | -$1.13 | -$1.16 |
| Diluted Shares (MM) | 6,806 | 7,348 | 7,466 | 7,503 | 7,587 | 7,074 |
| Free Cash Flow (MM) | $22,351 | $29,033 | $28,440 | $26,412 | $16,186 | $18,287 |
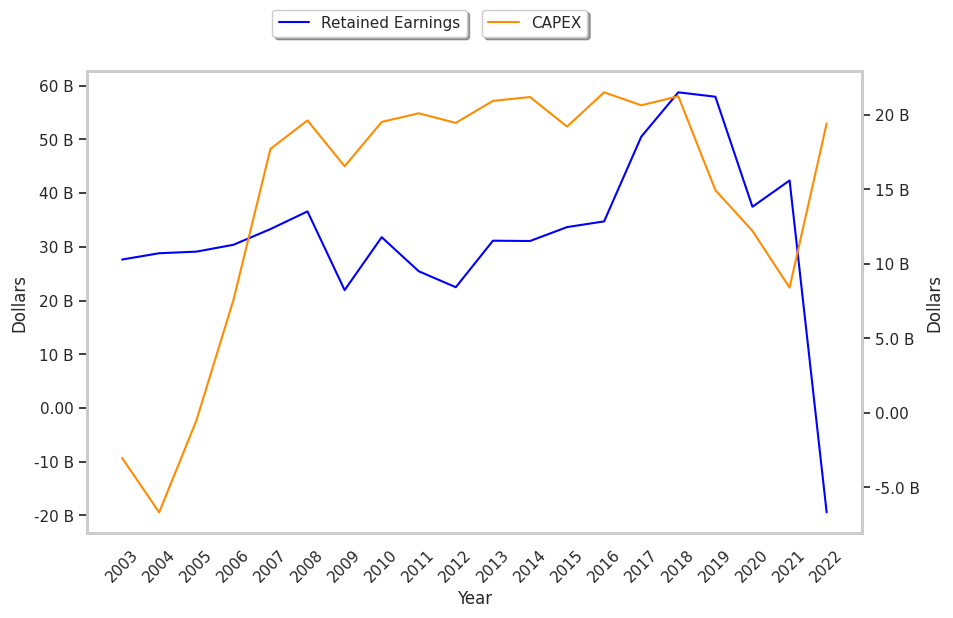
| Capital Expenditures (MM) | $21,251 | $19,635 | $14,690 | $15,545 | $19,626 | $18,755 |
| Net Current Assets (MM) | -$120,303 | -$121,861 | -$62,626 | $24,427 | -$59,174 | -$49,441 |
| Long Term Debt (MM) | $166,250 | $151,309 | $153,775 | $151,011 | $128,423 | $128,012 |
| Net Debt / EBITDA | 3.14 | 2.73 | 5.26 | 3.33 | 9.82 | 10.97 |
AT&T suffers from declining revenues and a flat capital expenditure trend, slimmer gross margins than its peers, and weak operating margins with a negative growth trend. The firm's financial statements also exhibit declining EPS growth and a highly leveraged balance sheet. AT&T has irregular cash flows.