It's been a great afternoon session for Welltower investors, who saw their shares rise 1.4% to a price of $89.04 per share. At these higher prices, is the company still fairly valued? If you are thinking about investing, make sure to check the company's fundamentals before making a decision.
Welltower's Valuation Is in Line With Its Sector Averages:
Welltower Inc. (NYSE:WELL), a real estate investment trust ("REIT") and S&P 500 company headquartered in Toledo, Ohio, is driving the transformation of health care infrastructure. The company belongs to the Real Estate sector, which has an average price to earnings (P/E) ratio of 24.81 and an average price to book (P/B) ratio of 2.24. In contrast, Welltower has a trailing 12 month P/E ratio of 168.0 and a P/B ratio of 2.06.
Welltower's PEG ratio is 1.94, which shows that the stock is probably overvalued in terms of its estimated growth. For reference, a PEG ratio near or below 1 is a potential signal that a company is undervalued.
The Company Has a Highly Leveraged Balance Sheet and a Declining EPS Growth Trend:
| 2018 | 2019 | 2020 | 2021 | 2022 | 2023 | |
|---|---|---|---|---|---|---|
| Revenue (MM) | $4,700 | $5,121 | $4,606 | $4,742 | $5,861 | $6,219 |
| Operating Margins | 9.0% | 11.0% | -1.0% | 4.0% | 3.0% | 3.0% |
| Net Margins | 18.0% | 26.0% | 23.0% | 8.0% | 3.0% | 2.0% |
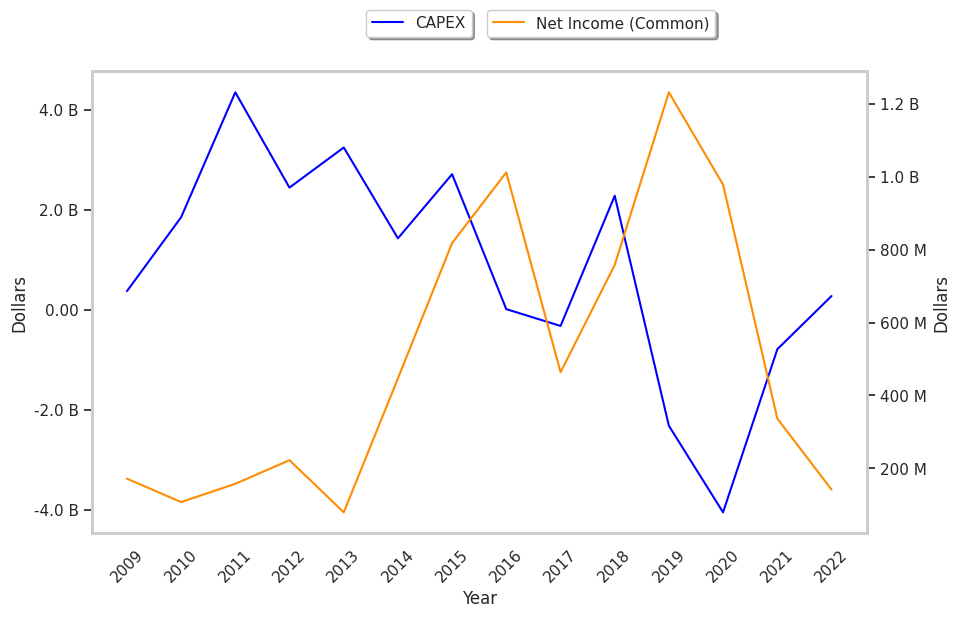
| Net Income (MM) | $830 | $1,330 | $1,039 | $374 | $161 | $134 |
| Net Interest Expense (MM) | $527 | $556 | $514 | $490 | $530 | $577 |
| Depreciation & Amort. (MM) | $950 | $1,027 | $1,038 | $1,038 | $1,310 | $1,377 |
| Earnings Per Share | $2.02 | $3.05 | $2.33 | $0.78 | $0.3 | $0.21 |
| Diluted Shares (MM) | 375 | 404 | 417 | 427 | 465 | 555 |
| Free Cash Flow (MM) | -$1,976 | $1,207 | $1,120 | $857 | $697 | $582 |
| Capital Expenditures (MM) | $3,560 | $329 | $245 | $418 | $632 | $819 |
| Net Current Assets (MM) | -$13,330 | -$15,208 | -$12,461 | -$12,484 | -$11,076 | -$8,892 |
| Long Term Debt (MM) | $14,329 | $16,385 | $14,193 | $14,644 | $14,869 | $17,815 |
| Net Debt / EBITDA | 10.27 | 10.26 | 12.56 | 11.9 | 9.6 | 9.88 |
Welltower's financial statements include several red flags such as weak operating margins with a negative growth trend, declining EPS growth, and a deteriorating pattern of cash flows. Additionally, the firm has a highly leveraged balance sheet. On the other hand, the company has growing revenues and decreasing reinvestment in the business working in its favor.