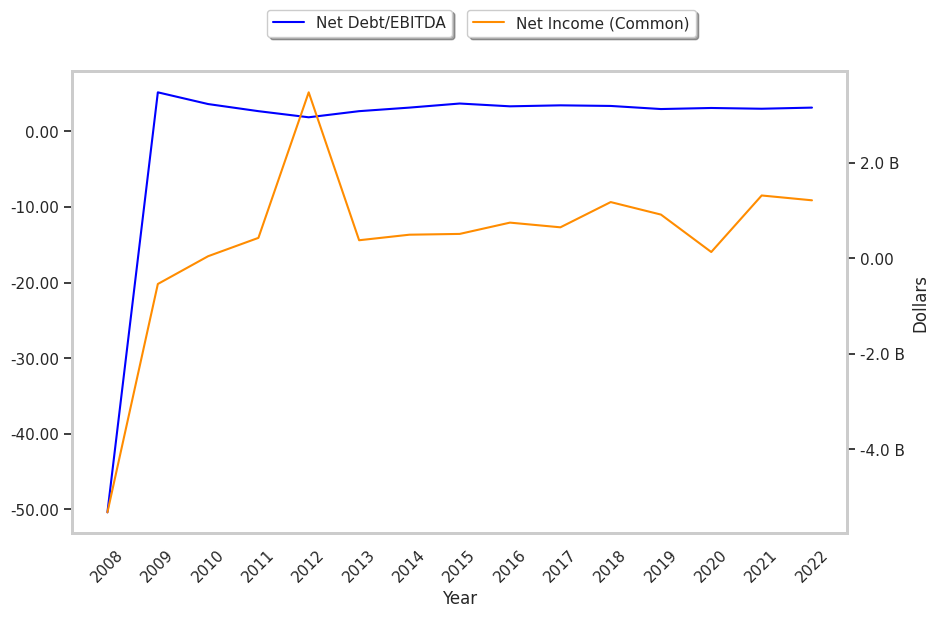
Broadcasting company Sirius XM is taking Wall Street by surprise today, falling to $4.77 and marking a -3.1% change compared to the S&P 500, which moved -0.0%.
SIRI currently sits within range of its analyst target price of $4.99, which implies that its price may remain stable for the near future. Indeed, the average analyst rating for the stock is hold. Over the last year, Sirius XM has underperfomed the S&P 500 by -38.0%, moving -23.0%.
Sirius XM Holdings Inc., an audio entertainment company, operates audio business including subscription entertainment services in the United States. The company is a consumer cyclical company, whose sales figures depend on discretionary income levels in its consumer base. For this reason, consumer cyclical companies have better sales and stock performance during periods of economic growth, when consumers have more of an incentive to spend their money on non-essential items.
Sirius XM's trailing 12 month P/E ratio is 14.9, based on its trailing EPS of $0.32. The company has a forward P/E ratio of 14.9 according to its forward EPS of $0.32 -- which is an estimate of what its earnings will look like in the next quarter. The P/E ratio is the company's share price divided by its earnings per share. In other words, it represents how much investors are willing to spend for each dollar of the company's earnings (revenues minus the cost of goods sold, taxes, and overhead). As of the first quarter of 2023, the consumer discretionary sector has an average P/E ratio of 22.33, and the average for the S&P 500 is 15.97.
To better understand SIRI’s valuation, we can divide its price to earnings ratio by its projected five-year growth rate, which gives us its price to earnings, or PEG ratio. Considering the P/E ratio in the context of growth is important, because many companies that are undervalued in terms of earnings are actually overvalued in terms of growth.
Sirius XM’s PEG is 2.02, which indicates that the company is overvalued compared to its growth prospects. Bear in mind that PEG ratios have limits to their relevance, since they are based on future growth estimates that may not turn out as expected.
To understand a company's long term business prospects, we must consider its gross profit margins, which is the ratio of its gross profits to its revenues. A wider gross profit margin indicates that a company may have a competitive advantage, as it is free to keep its product prices high relative to their cost. After looking at its annual reports, we obtained the following information on SIRI's margins:
| Date Reported | Revenue ($ k) | Cost of Revenue ($ k) | Gross Margins (%) | YoY Growth (%) |
|---|---|---|---|---|
| 2023 | 8,958,000 | 7,037,000 | 21 | -8.7 |
| 2022 | 9,003,000 | 6,967,000 | 23 | 0.0 |
| 2021 | 8,696,000 | 6,681,000 | 23 | 109.09 |
| 2020 | 8,040,000 | 7,182,000 | 11 | -47.62 |
| 2019 | 7,794,000 | 6,147,000 | 21 | -30.0 |
| 2018 | 5,771,000 | 4,044,000 | 30 |
- Average gross margin: 21.5 %
- Average gross margin growth rate: -5.4 %
- Coefficient of variability (higher numbers indicating more instability): 285.2 %
Sirius XM's gross margins indicate that its underlying business is viable, and that the stock is potentially worthy for investment -- as opposed to speculative -- purposes.
When we subtract capital expenditures from operating cash flows, we are left with the company's free cash flow, which for Sirius XM was $1.33 Billion as of its last annual report. The balance of cash flows represents the capital that is available for re-investment in the business, or for payouts to equity investors as dividends. The company's average cash flow over the last 4 years has been $1.56 Billion and they've been growing at an average rate of -2.3%. SIRI's weak free cash flow trend shows that it might not be able to sustain its dividend payments, which over the last 12 months has yielded 2.0% to investors. Cutting the dividend can compound a company's problems by causing investors to sell their shares, which further pushes down its stock price.
Sirius XM is likely overvalued at today's prices because it has a very low P/E ratio, no publishedP/B ratio, and a deteriorating pattern of cash flows with a flat trend. The stock has poor growth indicators because of its decent operating margins with a negative growth trend, and an inflated PEG ratio. We hope this preliminary analysis will encourage you to do your own research into SIRI's fundamental values -- especially their trends over the last few years, which provide the clearest picture of the company's valuation.


