Today we're going to take a closer look at large-cap Telecommunications company Cisco Systems, whose shares are currently trading at $52.49. We've been asking ourselves whether the company is under or over valued at today's prices... let's perform a brief value analysis to find out!
Cisco Systems's Valuation Is in Line With Its Sector Averages:
Cisco Systems, Inc. designs, manufactures, and sells Internet Protocol based networking and other products related to the communications and information technology industry in the Americas, Europe, the Middle East, Africa, the Asia Pacific, Japan, and China. The company belongs to the Telecommunications sector, which has an average price to earnings (P/E) ratio of 18.85 and an average price to book (P/B) ratio of 3.12. In contrast, Cisco Systems has a trailing 12 month P/E ratio of 17.1 and a P/B ratio of 4.81.
Cisco Systems's PEG ratio is 2.28, which shows that the stock is probably overvalued in terms of its estimated growth. For reference, a PEG ratio near or below 1 is a potential signal that a company is undervalued.
Wider Gross Margins Than the Industry Average of 53.85%:
| 2018 | 2019 | 2020 | 2021 | 2022 | 2023 | |
|---|---|---|---|---|---|---|
| Revenue (MM) | $49,330 | $51,904 | $49,301 | $49,818 | $51,557 | $56,998 |
| Gross Margins | 62% | 63% | 64% | 64% | 63% | 63% |
| Operating Margins | 26.0% | 28.0% | 28.0% | 27.0% | 28.0% | 27.0% |
| Net Margins | 0.0% | 22.0% | 23.0% | 21.0% | 23.0% | 22.0% |
| Net Income (MM) | $110 | $11,621 | $11,214 | $10,591 | $11,812 | $12,613 |
| Net Interest Expense (MM) | $943 | $859 | $585 | $434 | $508 | $427 |
| Depreciation & Amort. (MM) | $221 | $150 | $141 | $215 | $313 | $282 |
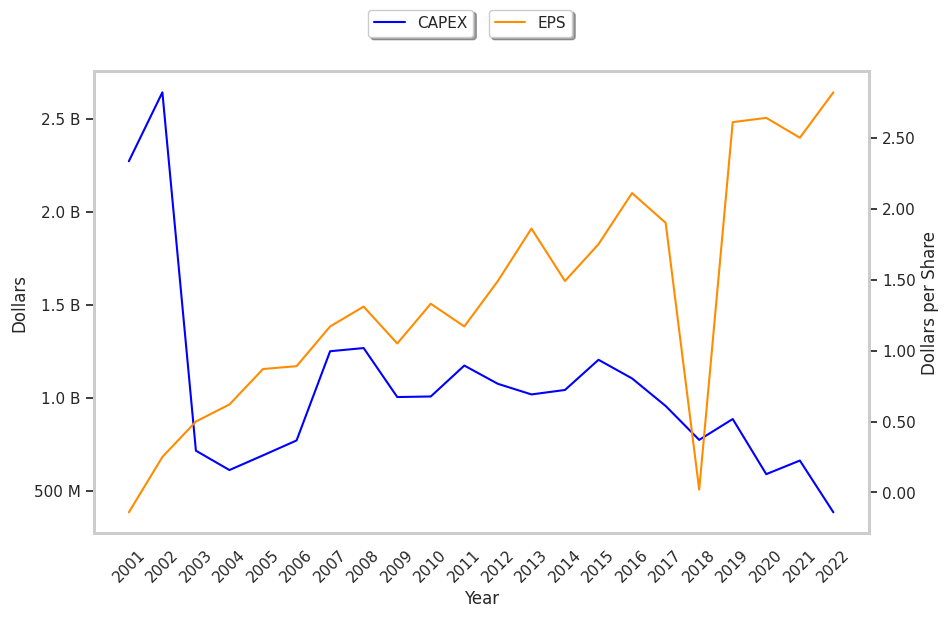
| Earnings Per Share | $0.02 | $2.61 | $2.64 | $2.5 | $2.82 | $3.07 |
| Diluted Shares (MM) | 4,881 | 4,453 | 4,254 | 4,236 | 4,192 | 4,105 |
| Free Cash Flow (MM) | $12,832 | $14,922 | $14,656 | $14,762 | $12,749 | $19,037 |
| Capital Expenditures (MM) | $834 | $909 | $770 | $692 | $477 | $849 |
| Net Current Assets (MM) | -$5,895 | -$16,353 | -$13,857 | -$15,692 | -$16,641 | -$14,151 |
| Long Term Debt (MM) | $8,998 | $5,563 | $778 | $443 | $7,629 | $827 |
| Net Debt / EBITDA | -2.13 | -2.37 | -0.36 | -1.59 | -0.65 | -1.45 |
Cisco Systems has strong margins with a stable trend and exceptional EPS growth. Additionally, the company's financial statements display low leverage and wider gross margins than its peer group. Furthermore, Cisco Systems has weak revenue growth and a flat capital expenditure trend and irregular cash flows.