AGNC Investment Corp. announced on Friday its preliminary estimates for certain financial measures for the third quarter of 2023. The company's tangible net book value as of September 30, 2023, was estimated to be $8.08 per share of common stock. For the third quarter, the total comprehensive loss was estimated to be $(1.02) per common share. AGNC's net spread and dollar roll income for the third quarter of 2023, excluding catch-up premium amortization benefit, was estimated to be $0.65 per common share. The company's total investment portfolio as of September 30, 2023, was approximately $59.3 billion.
In a quote from the press release, AGNC Investment Corp. stated, "We are pleased with our performance in the third quarter, despite the challenging market conditions."
AGNC Investment logged a 1.6% change Friday, and is now trading at a price of $8.4 per share.
AGNC Investment returned losses of -9.0% last year, with its stock price reaching a high of $12.25 and a low of $6.81. Over the same period, the stock underperformed the S&P 500 index by -21.0%. As of April 2023, the company's 50-day average price was $8.91. AGNC Investment Corp. operates as a real estate investment trust (REIT) in the United States. Based in Bethesda, MD, the mid-cap Real Estate company has 51 full time employees. AGNC Investment has offered a 17.4% dividend yield over the last 12 months.
The Company's Revenues Are Declining:
| 2018 | 2019 | 2020 | 2021 | 2022 | 2023 | |
|---|---|---|---|---|---|---|
| Revenue (MM) | $1,949 | $2,842 | $1,519 | $1,361 | $1,590 | $1,528 |
| Net Margins | 7.0% | 24.0% | -18.0% | 55.0% | -75.0% | 2.0% |
| Net Income (MM) | $129 | $688 | -$266 | $749 | -$1,190 | $30 |
| Net Interest Expense (MM) | $1,173 | $2,149 | $845 | $1,286 | $965 | $1,493 |
| Earnings Per Share | $0.21 | $1.16 | -$0.66 | $1.22 | -$2.41 | -$0.13 |
| Diluted Shares (MM) | 441 | 541 | 552 | 530 | 537 | 666 |
| Free Cash Flow (MM) | $1,113 | $1,180 | $1,747 | $1,540 | $1,013 | $285 |
| Net Current Assets (MM) | -$99,321 | -$101,867 | -$70,925 | -$57,761 | -$44,248 | -$52,167 |
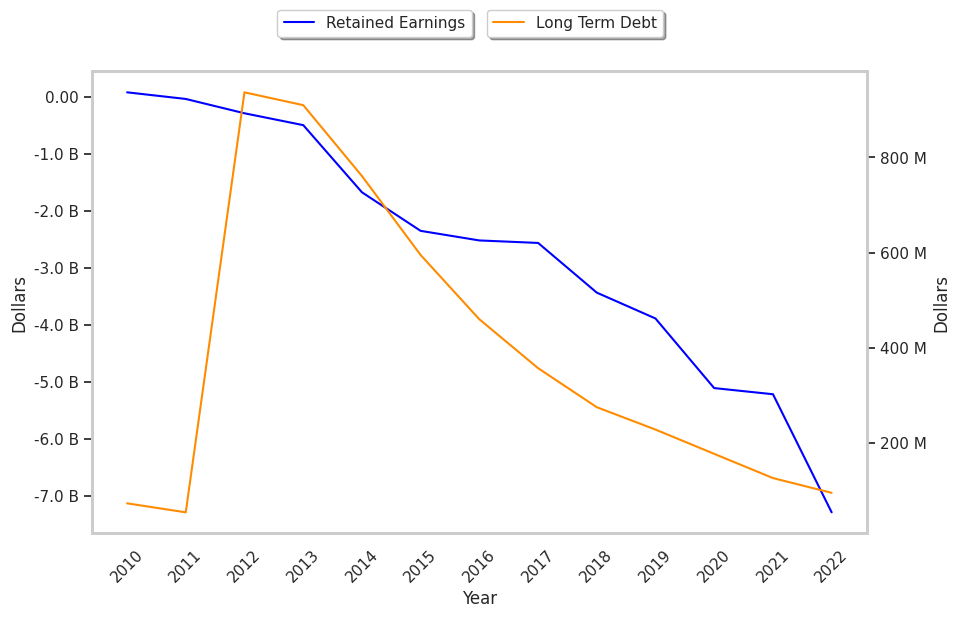
| Long Term Debt (MM) | $99,145 | $101,931 | $70,646 | $57,684 | $43,679 | $52,420 |
AGNC Investment suffers from declining revenues and no capital expenditures, negative net margins with a negative growth trend, and declining EPS growth. The firm's financial statements also exhibit a deteriorating pattern of cash flows and high levels of debt.
AGNC Investment Has Attractive P/B and P/E Ratios:
AGNC Investment has a trailing twelve month P/E ratio of 18.6, compared to an average of 24.81 for the Real Estate sector. Based on its EPS guidance of $2.15, the company has a forward P/E ratio of 4.1. The company doesn't issue forward earnings guidance, and the compound average growth rate of its last 6 years of reported EPS is -19.3%. On this basis, the company's PEG ratio is -0.96, which indicates that its shares are overpriced. In contrast, the market is likely undervaluing AGNC Investment in terms of its equity because its P/B ratio is 0.94 while the sector average is 2.24.
AGNC Investment Has an Analyst Consensus of Strong Upside Potential:
The 9 analysts following AGNC Investment have set target prices ranging from $10.0 to $11.5 per share, for an average of $10.61 with a buy rating. As of April 2023, the company is trading -16.0% away from its average target price, indicating that there is an analyst consensus of strong upside potential.
AGNC Investment has an average amount of shares sold short because 5.9% of the company's shares are sold short. Institutions own 44.3% of the company's shares, and the insider ownership rate stands at 0.59%, suggesting a small amount of insider investors. The largest shareholder is Vanguard Group Inc, whose 9% stake in the company is worth $479,681,911.