General Electric Company logged a 0.9% change during today's afternoon session, and is now trading at a price of $116.6 per share.
General Electric Company returned gains of 72.0% last year, with its stock price reaching a high of $117.96 and a low of $59.87. Over the same period, the stock outperformed the S&P 500 index by 59.0%. More recently, the company's 50-day average price was $111.24. General Electric Company operates as a high-tech industrial company in Europe, China, Asia, the Americas, the Middle East, and Africa. Based in Boston, MA, the large-cap Technology company has 172,000 full time employees. General Electric Company has returned a 0.3% dividend yield over the last 12 months, but this may not be sustainable seen that the company has a choppy cash flow record.
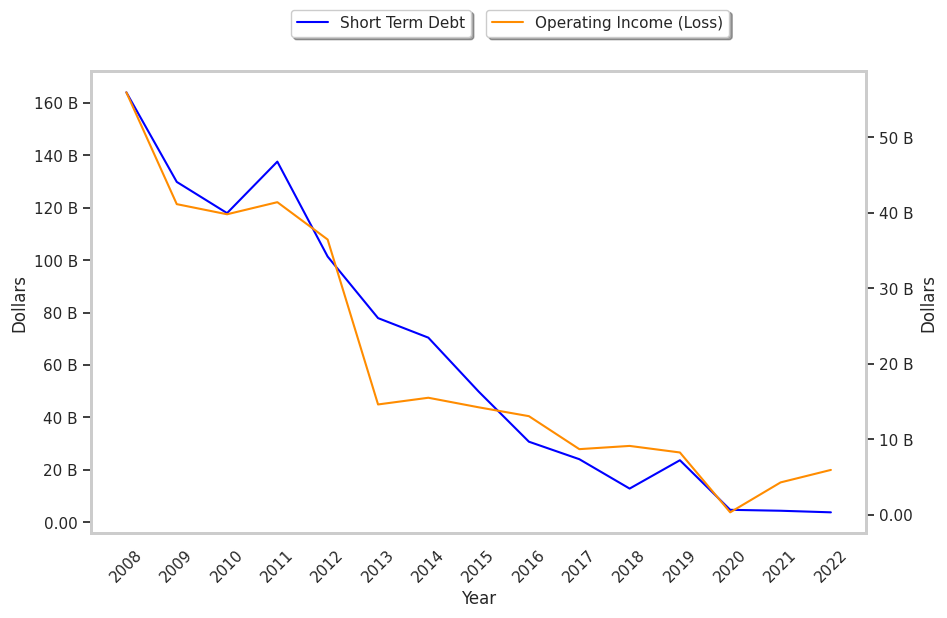
The Company's Revenues Are Declining:
| 2018 | 2019 | 2020 | 2021 | 2022 | 2023 | |
|---|---|---|---|---|---|---|
| Revenue (MM) | $113,543 | $113,543 | $58,025 | $56,469 | $58,100 | $62,483 |
| Gross Margins | -6% | 18% | -13% | -15% | -3% | 0% |
| Operating Margins | -18.0% | 0.0% | -11.0% | -9.0% | -1.0% | 15.0% |
| Net Margins | 0.0% | 0.0% | 10.0% | 0.0% | 1.0% | 16.0% |
| Net Income (MM) | -$89 | $66 | $5,704 | -$71 | $407 | $9,899 |
| Net Interest Expense (MM) | $2,321 | $2,479 | -$948 | $2,696 | $1,172 | $9,123 |
| Depreciation & Amort. (MM) | $5,562 | $2,018 | $1,895 | $3,645 | $1,338 | $1,500 |
| Earnings Per Share | -$2.62 | -$4.99 | $4.64 | -$6.0 | $0.05 | $8.67 |
| Diluted Shares (MM) | 8,691 | 1,091 | 1,094 | 1,098 | 1,096 | 1,092 |
| Free Cash Flow (MM) | -$13,947 | -$3,359 | -$17,407 | -$22,341 | -$4,975 | -$6,301 |
| Capital Expenditures (MM) | $18,925 | $12,197 | $20,818 | $25,822 | $10,891 | $12,438 |
| Net Current Assets (MM) | -$181,329 | -$184,218 | -$134,285 | -$112,143 | -$95,554 | -$70,425 |
| Long Term Debt (MM) | $225,843 | $218,525 | $142,580 | $109,139 | $87,453 | $68,879 |
| Net Debt / EBITDA | -13.17 | 103.63 | -28.3 | -89.47 | 155.9 | 6.84 |
General Electric Company suffers from declining revenues and decreasing reinvestment in the business, slimmer gross margins than its peers, and consistently negative margins with a positive growth rate. The firm's financial statements also exhibit an unconvincing cash flow history and a highly leveraged balance sheet. On the other hand, the company has a strong EPS growth trend working in its favor.
A Lower P/B Ratio Than Its Sector Average but Trades Above Its Graham Number:
General Electric Company has a trailing twelve month P/E ratio of 11.6, compared to an average of 27.16 for the Technology sector. Based on its EPS guidance of $4.62, the company has a forward P/E ratio of 24.1. The company doesn't provide forward earnings guidance, and the compound average growth rate of its last 6 years of reported EPS is 27.6%. On this basis, General Electric Company's PEG ratio is 0.42. Using instead the 10.7% weighted average of General Electric Company's earnings CAGR and the broader market's anticipated 5-year EPS growth rate, the company's PEG ratio is 1.08, which shows that its shares might be fairly priced. Additionally, the market is possibly undervaluing General Electric Company in terms of its equity because its P/B ratio is 4.43 whereas the sector average is 6.23. The company's shares are currently trading 55.5% above their Graham number.
General Electric Company Has an Average Rating of Buy:
The 16 analysts following General Electric Company have set target prices ranging from $84.2 to $150.0 per share, for an average of $127.7 with a buy rating. As of April 2023, the company is trading -12.9% away from its average target price, indicating that there is an analyst consensus of some upside potential.
General Electric Company has a very low short interest because 0.7% of the company's shares are sold short. Institutions own 76.5% of the company's shares, and the insider ownership rate stands at 0.2%, suggesting a small amount of insider investors. The largest shareholder is Vanguard Group Inc, whose 8% stake in the company is worth $10,237,480,215.