We've been asking ourselves recently if the market has placed a fair valuation on Verizon Communications. Let's dive into some of the fundamental values of this large-cap Telecommunications company to determine if there might be an opportunity here for value-minded investors.
The Market May Be Undervaluing Verizon Communications's Earnings and Assets:
Verizon Communications Inc., through its subsidiaries, provides communications, technology, information, and entertainment products and services to consumers, businesses, and governmental entities worldwide. The company belongs to the Telecommunications sector, which has an average price to earnings (P/E) ratio of 18.85 and an average price to book (P/B) ratio of 3.12. In contrast, Verizon Communications has a trailing 12 month P/E ratio of 7.2 and a P/B ratio of 1.55.
Verizon Communications's PEG ratio is 14.38, which shows that the stock is probably overvalued in terms of its estimated growth. For reference, a PEG ratio near or below 1 is a potential signal that a company is undervalued.
Overview of the Company's Finances:
| 2018 | 2019 | 2020 | 2021 | 2022 | 2023 | |
|---|---|---|---|---|---|---|
| Revenue (MM) | $130,863 | $131,868 | $128,292 | $133,613 | $136,835 | $135,000 |
| Gross Margins | 17% | 23% | 22% | 24% | 22% | 22% |
| Operating Margins | 17.0% | 23.0% | 22.0% | 24.0% | 22.0% | 22.0% |
| Net Margins | 12.0% | 15.0% | 14.0% | 17.0% | 16.0% | 16.0% |
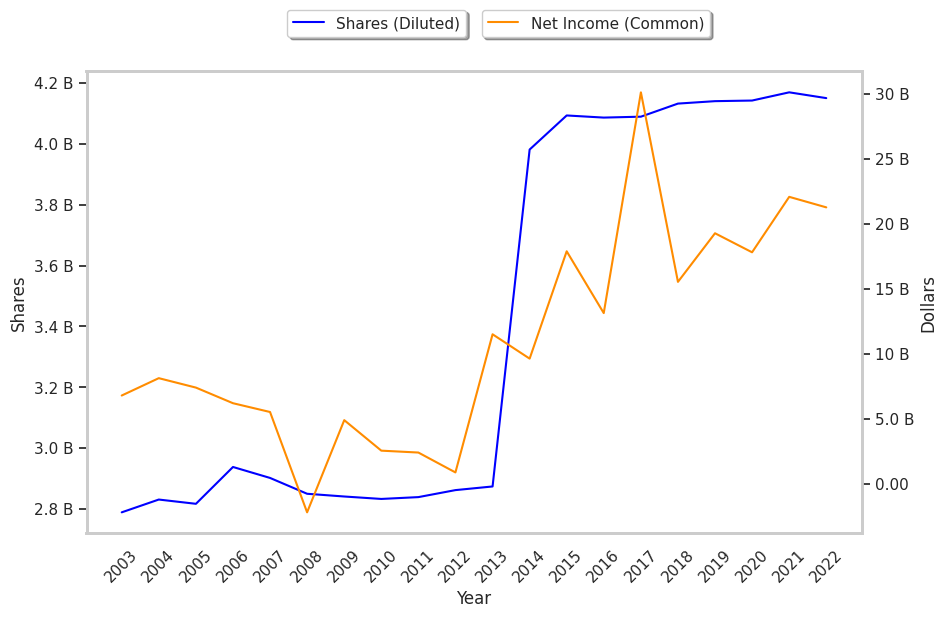
| Net Income (MM) | $16,039 | $19,788 | $18,348 | $22,618 | $21,748 | $21,506 |
| Net Interest Expense (MM) | $4,833 | $4,730 | $4,247 | $3,485 | $3,613 | $4,534 |
| Depreciation & Amort. (MM) | $17,403 | $16,682 | $16,720 | $16,206 | $17,099 | $17,219 |
| Earnings Per Share | $3.76 | $4.65 | $4.3 | $5.32 | $5.06 | $5.0 |
| Diluted Shares (MM) | 4,132 | 4,140 | 4,142 | 4,150 | 4,204 | 4,224 |
| Free Cash Flow (MM) | $17,681 | $17,807 | $23,576 | $19,253 | $14,054 | $14,830 |
| Capital Expenditures (MM) | $16,658 | $17,939 | $18,192 | $20,286 | $23,087 | $22,666 |
| Net Current Assets (MM) | -$175,483 | -$191,419 | -$192,615 | -$246,668 | -$249,360 | -$246,065 |
| Long Term Debt (MM) | $105,873 | $100,712 | $123,173 | $143,425 | $140,676 | $137,871 |
| Net Debt / EBITDA | 2.78 | 2.31 | 2.46 | 3.05 | 3.12 | 3.15 |
Verizon Communications has average net margins with a stable trend, irregular cash flows, and significant leverage. We also note that the company benefits from weak revenue growth and increasing reinvestment in the business and positive EPS growth. However, the firm has slimmer gross margins than its peers.