We've been asking ourselves recently if the market has placed a fair valuation on Archer-Daniels-Midland Company. Let's dive into some of the fundamental values of this large-cap Consumer Staples company to determine if there might be an opportunity here for value-minded investors.
Archer-Daniels-Midland Company's Earnings and Assets May Be Undervalued:
Archer-Daniels-Midland Company procures, transports, stores, processes, and merchandises agricultural commodities, products, and ingredients in the United States, Switzerland, the Cayman Islands, Brazil, Mexico, Canada, the United Kingdom, and internationally. The company belongs to the Consumer Staples sector, which has an average price to earnings (P/E) ratio of 24.36 and an average price to book (P/B) ratio of 4.29. In contrast, Archer-Daniels-Midland Company has a trailing 12 month P/E ratio of 10.3 and a P/B ratio of 1.57.
When we divide Archer-Daniels-Midland Company's P/E ratio by its expected EPS growth rate of the next five years, we obtain its PEG ratio of -1.92. Since it's negative, the company has negative growth expectations, and most investors will probably avoid the stock unless it has an exceptionally low P/E and P/B ratio.
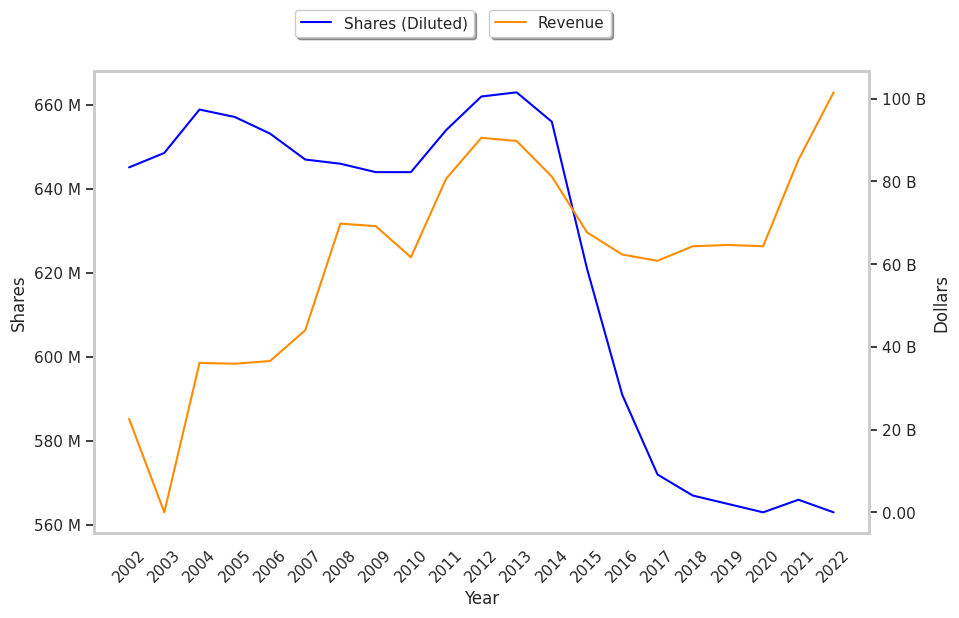
Growing Revenues With Increasing Reinvestment in the Business:
| 2018 | 2019 | 2020 | 2021 | 2022 | 2023 | |
|---|---|---|---|---|---|---|
| Revenue (MM) | $64,341 | $64,656 | $64,355 | $85,249 | $101,556 | $99,884 |
| Gross Margins | 6% | 6% | 7% | 7% | 7% | 8% |
| Operating Margins | 3.0% | 2.0% | 3.0% | 4.0% | 5.0% | 5.0% |
| Net Margins | 3.0% | 2.0% | 3.0% | 3.0% | 4.0% | 4.0% |
| Net Income (MM) | $1,815 | $1,379 | $1,782 | $2,735 | $4,365 | $4,161 |
| Net Interest Expense (MM) | $364 | $402 | $339 | $265 | $396 | $558 |
| Depreciation & Amort. (MM) | $941 | $993 | $976 | $996 | $1,028 | $1,035 |
| Earnings Per Share | $3.19 | $2.44 | $3.15 | $4.79 | $7.71 | $7.49 |
| Diluted Shares (MM) | 567 | 565 | 565 | 566 | 563 | 524 |
| Free Cash Flow (MM) | -$5,626 | -$6,280 | -$3,209 | $5,426 | $2,159 | $3,619 |
| Capital Expenditures (MM) | $842 | $828 | $823 | $1,169 | $1,319 | $1,433 |
| Net Current Assets (MM) | -$1,200 | -$3,367 | -$2,337 | -$1,460 | $252 | $466 |
| Long Term Debt (MM) | $7,698 | $7,672 | $7,885 | $8,011 | $7,735 | $8,244 |
| Net Debt / EBITDA | 3.54 | 4.82 | 5.22 | 3.88 | 2.75 | 2.52 |
Archer-Daniels-Midland Company's financial statements include several red flags such as slimmer gross margins than its peers, weak operating margins with a positive growth rate, and an unconvincing cash flow history. Additionally, the firm has a highly leveraged balance sheet. On the other hand, the company benefits from growing revenues and increasing reinvestment in the business and a strong EPS growth trend.