Microsoft logged a -1.2% change during today's morning session, and is now trading at a price of $371.66 per share.
Microsoft returned gains of 54.0% last year, with its stock price reaching a high of $376.35 and a low of $219.35. Over the same period, the stock outperformed the S&P 500 index by 39.0%. More recently, the company's 50-day average price was $335.46. Microsoft Corporation develops and supports software, services, devices and solutions worldwide. Based in Redmond, WA, the large-cap Technology company has 221,000 full time employees. Microsoft has offered a 0.7% dividend yield over the last 12 months.
Growing Revenues With Increasing Reinvestment in the Business:
| 2018 | 2019 | 2020 | 2021 | 2022 | 2023 | |
|---|---|---|---|---|---|---|
| Revenue (MM) | $110,360 | $125,843 | $143,015 | $168,088 | $198,270 | $211,915 |
| Gross Margins | 65% | 66% | 68% | 69% | 68% | 69% |
| Operating Margins | 33.0% | 35.0% | 37.0% | 42.0% | 42.0% | 42.0% |
| Net Margins | 15.0% | 31.0% | 31.0% | 36.0% | 37.0% | 34.0% |
| Net Income (MM) | $16,571 | $39,240 | $44,281 | $61,271 | $72,738 | $72,361 |
| Net Interest Expense (MM) | $2,733 | $2,686 | $2,591 | $2,346 | $2,063 | $1,968 |
| Depreciation & Amort. (MM) | $7,700 | $9,700 | $10,700 | $9,300 | $12,600 | $11,000 |
| Earnings Per Share | $2.13 | $5.06 | $5.76 | $8.05 | $9.65 | $9.68 |
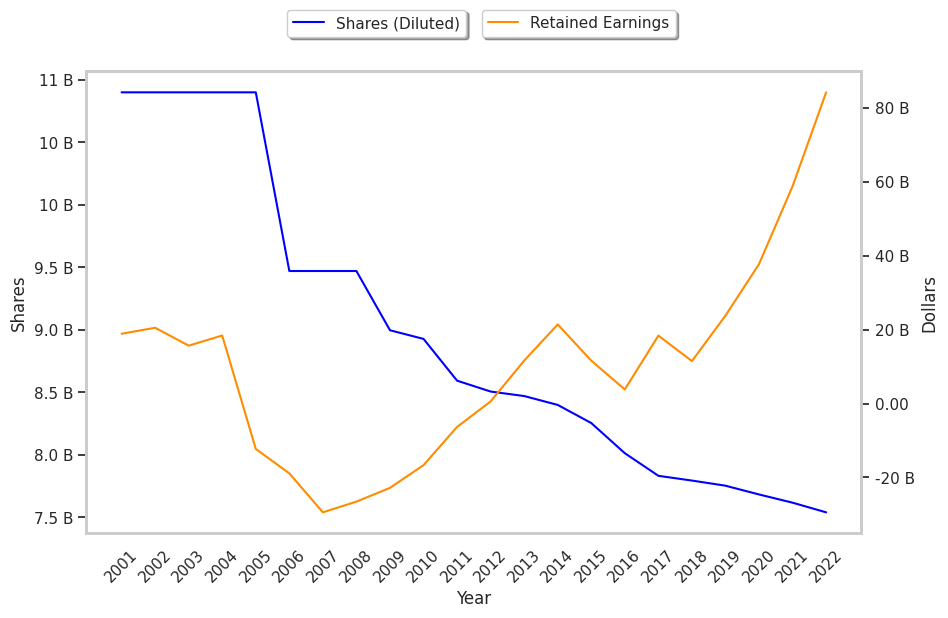
| Diluted Shares (MM) | 7,794 | 7,753 | 7,683 | 7,608 | 7,540 | 7,472 |
| Free Cash Flow (MM) | $32,252 | $38,260 | $45,234 | $56,118 | $65,149 | $59,475 |
| Capital Expenditures (MM) | $11,632 | $13,925 | $15,441 | $20,622 | $23,886 | $28,107 |
| Net Current Assets (MM) | -$9,857 | -$5,611 | $72 | -$6,191 | -$23,593 | -$21,496 |
| Long Term Debt (MM) | $69,653 | $63,361 | $55,136 | $48,260 | $44,119 | $41,990 |
| Net Debt / EBITDA | 1.51 | 1.14 | 0.72 | 0.41 | 0.34 | 0.12 |
Microsoft benefits from growing revenues and increasing reinvestment in the business, strong margins with a stable trend, and exceptional EPS growth. The company's financial statements show low leverage and generally positive cash flows. However, the firm has slimmer gross margins than its peers.
Microsoft's P/B and P/E Ratios Are Higher Than Average:
Microsoft has a trailing twelve month P/E ratio of 32.5, compared to an average of 27.16 for the Technology sector. Based on its EPS guidance of $11.93, the company has a forward P/E ratio of 28.1. The company doesn't provide forward earnings guidance, and the compound average growth rate of its last 6 years of reported EPS is 28.7%. On this basis, Microsoft's PEG ratio is 1.13. Using instead the 10.7% weighted average of Microsoft's earnings CAGR and the broader market's anticipated 5-year EPS growth rate, the company's PEG ratio is 3.03, which suggests that its shares may be overpriced. Furthermore, Microsoft is likely overvalued compared to the book value of its equity, since its P/B ratio of 12.51 is higher than the sector average of 6.23. The company's shares are currently trading 378.4% above their Graham number. Overall, Microsoft's lofty valuation in terms of earnings and assets is to some extent attenuated by its strong cash flow trend and reasonable levels of debt.
There's an Analyst Consensus of Little Upside Potential for Microsoft:
The 46 analysts following Microsoft have set target prices ranging from $262.56 to $414.57 per share, for an average of $371.56 with a buy rating. As of April 2023, the company is trading -9.7% away from its average target price, indicating that there is an analyst consensus of little upside potential.
Microsoft has a very low short interest because 0.5% of the company's shares are sold short. Institutions own 73.2% of the company's shares, and the insider ownership rate stands at 0.05%, suggesting a small amount of insider investors. The largest shareholder is Vanguard Group Inc, whose 9% stake in the company is worth $241,284,276,740.