We've been asking ourselves recently if the market has placed a fair valuation on Applied Materials. Let's dive into some of the fundamental values of this large-cap Technology company to determine if there might be an opportunity here for value-minded investors.
A Lower P/E Ratio Than Its Sector Average but Trades Above Its Graham Number:
Applied Materials, Inc. engages in the provision of manufacturing equipment, services, and software to the semiconductor, display, and related industries. The company belongs to the Technology sector, which has an average price to earnings (P/E) ratio of 27.16 and an average price to book (P/B) ratio of 6.23. In contrast, Applied Materials has a trailing 12 month P/E ratio of 18.5 and a P/B ratio of 7.66.
Applied Materials's PEG ratio is 1.47, which shows that the stock is probably overvalued in terms of its estimated growth. For reference, a PEG ratio near or below 1 is a potential signal that a company is undervalued.
Growing Revenues With Increasing Reinvestment in the Business:
| 2018 | 2019 | 2020 | 2021 | 2022 | 2023 | |
|---|---|---|---|---|---|---|
| Revenue (MM) | $17,253 | $14,608 | $17,202 | $23,063 | $25,785 | $26,543 |
| Gross Margins | 44.0% | 44.0% | 45.0% | 47.0% | 47.0% | 46.0% |
| Operating Margins | 27.0% | 23.0% | 25.0% | 30.0% | 30.0% | 28.0% |
| Net Margins | 18.0% | 19.0% | 21.0% | 26.0% | 25.0% | 24.0% |
| Net Income (MM) | $3,038 | $2,706 | $3,619 | $5,888 | $6,525 | $6,443 |
| Net Interest Expense (MM) | $234 | $237 | $240 | $236 | $228 | $237 |
| Depreciation & Amort. (MM) | $457 | $363 | $376 | $394 | $444 | $444 |
| Earnings Per Share | $2.96 | $2.86 | $3.92 | $6.4 | $7.44 | $7.58 |
| Diluted Shares (MM) | 1,026 | 945 | 923 | 919 | 877 | 767 |
| Free Cash Flow (MM) | $3,165 | $2,806 | $3,382 | $4,774 | $4,612 | $6,982 |
| Capital Expenditures (MM) | $622 | $441 | $422 | $668 | $787 | $1,020 |
| Net Current Assets (MM) | -$184 | -$604 | $1,594 | $2,529 | $1,393 | $3,562 |
| Long Term Debt (MM) | $5,309 | $4,713 | $5,448 | $5,452 | $5,457 | $5,460 |
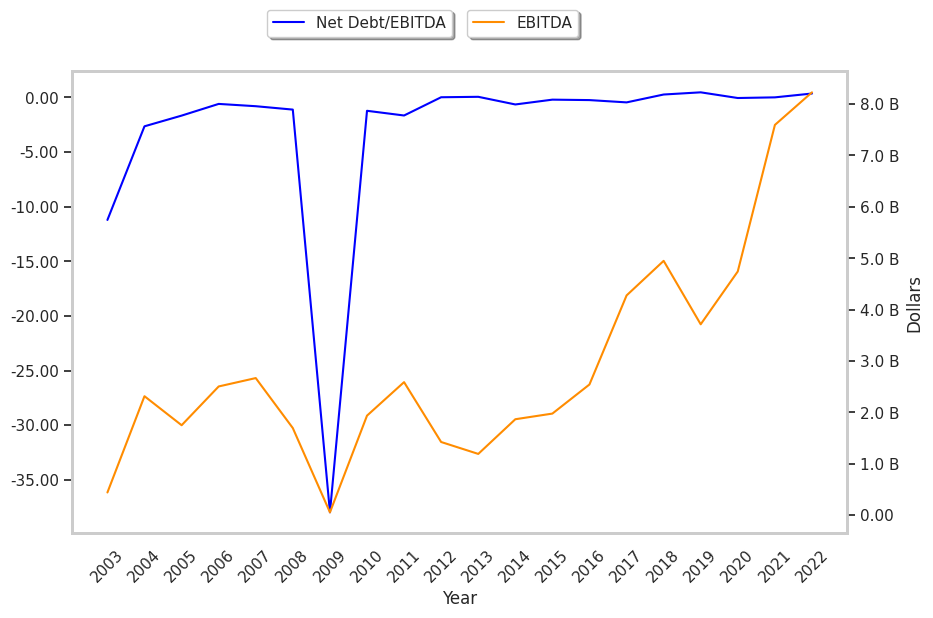
| Net Debt / EBITDA | 0.36 | 0.59 | 0.11 | 0.05 | 0.41 | -0.08 |
Applied Materials has growing revenues and increasing reinvestment in the business and low leverage. Additionally, the company's financial statements display a strong EPS growth trend and generally positive cash flows. However, the firm has slimmer gross margins than its peers. Finally, we note that Applied Materials has average net margins with a stable trend.