A strong performer from today's evening trading session is Ulta Beauty, whose shares rose 1.1% to $409.49 per share. For those of you thinking about investing in the stock, here is a brief value analysis of the stock using the company's basic fundamental ratios.
A Lower P/E Ratio Than Its Sector Average but Trades Above Its Graham Number:
Ulta Beauty, Inc. operate specialty retail stores selling cosmetics, fragrance, haircare and skincare products, and related accessories and services in the United States. The company belongs to the Consumer Discretionary sector, which has an average price to earnings (P/E) ratio of 22.33 and an average price to book (P/B) ratio of 3.12. In contrast, Ulta Beauty has a trailing 12 month P/E ratio of 16.4 and a P/B ratio of 9.85.
Ulta Beauty's PEG ratio is 2.56, which shows that the stock is probably overvalued in terms of its estimated growth. For reference, a PEG ratio near or below 1 is a potential signal that a company is undervalued.
Wider Gross Margins Than the Industry Average of 23.25%:
| 2018 | 2019 | 2020 | 2021 | 2022 | 2023 | |
|---|---|---|---|---|---|---|
| Revenue (MM) | $5,885 | $6,717 | $7,398 | $6,152 | $8,631 | $10,209 |
| Gross Margins | 36.0% | 36.0% | 36.0% | 32.0% | 39.0% | 40.0% |
| Operating Margins | 13.0% | 13.0% | 12.0% | 4.0% | 15.0% | 16.0% |
| Net Margins | 9.0% | 10.0% | 10.0% | 3.0% | 11.0% | 12.0% |
| Net Income (MM) | $555 | $659 | $706 | $176 | $986 | $1,242 |
| Net Interest Expense (MM) | $2 | $5 | $5 | $7 | $2 | $5 |
| Depreciation & Amort. (MM) | $253 | $279 | $296 | $298 | $268 | $241 |
| Earnings Per Share | $8.96 | $10.94 | $12.15 | $3.11 | $17.98 | $24.01 |
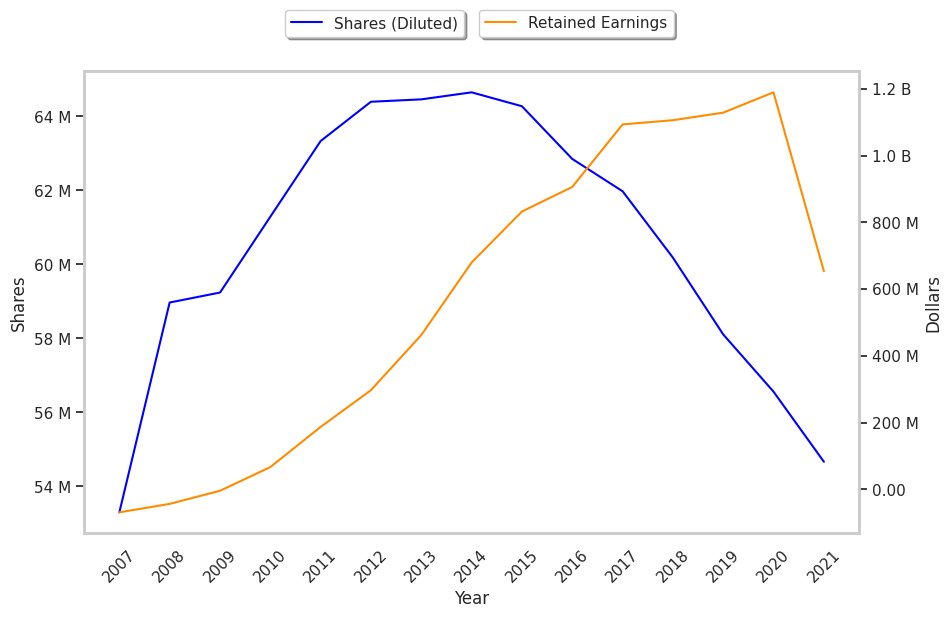
| Diluted Shares (MM) | 62 | 60 | 58 | 57 | 55 | 52 |
| Free Cash Flow (MM) | $194 | $637 | $803 | $658 | $887 | $1,170 |
| Capital Expenditures (MM) | $441 | $319 | $299 | $152 | $172 | $312 |
| Net Current Assets (MM) | $529 | -$984 | -$772 | -$467 | -$663 | -$678 |
| Long Term Debt (MM) | $428 | $1,722 | $1,705 | $1,610 | $1,666 | $1,655 |
| Net Debt / EBITDA | 0.15 | 1.2 | 0.95 | 1.35 | 0.9 | 0.53 |
Ulta Beauty has low leverage, growing revenues and decreasing reinvestment in the business, and wider gross margins than its peer group. The company also benefits from decent operating margins with a stable trend, a strong EPS growth trend, and generally positive cash flows.