We've been asking ourselves recently if the market has placed a fair valuation on Merck & Company. Let's dive into some of the fundamental values of this large-cap Health Care company to determine if there might be an opportunity here for value-minded investors.
The Market May Be Overvaluing Merck & Company's Earnings and Assets:
Merck & Co., Inc. operates as a healthcare company worldwide. The company belongs to the Health Care sector, which has an average price to earnings (P/E) ratio of 24.45 and an average price to book (P/B) ratio of 4.16. In contrast, Merck & Company has a trailing 12 month P/E ratio of 56.6 and a P/B ratio of 6.26.
Merck & Company's PEG ratio is 6.88, which shows that the stock is probably overvalued in terms of its estimated growth. For reference, a PEG ratio near or below 1 is a potential signal that a company is undervalued.
Growing Revenues With Increasing Reinvestment in the Business:
| 2018 | 2019 | 2020 | 2021 | 2022 | 2023 | |
|---|---|---|---|---|---|---|
| Revenue (MM) | $42,294 | $39,121 | $41,518 | $48,704 | $59,283 | $58,311 |
| Gross Margins | 68% | 69% | 67% | 72% | 71% | 73% |
| Operating Margins | 21% | 18% | 14% | 28% | 28% | 25% |
| Net Margins | 15% | 25% | 17% | 27% | 25% | 25% |
| Net Income (MM) | $6,220 | $9,843 | $7,082 | $13,049 | $14,526 | $14,519 |
| Net Interest Expense (MM) | $772 | $893 | $890 | $1,341 | $962 | $998 |
| Depreciation & Amort. (MM) | $4,519 | $3,652 | $1,669 | $1,578 | $1,824 | $1,803 |
| Earnings Per Share | $2.32 | $3.81 | $2.78 | $5.14 | $5.71 | $1.22 |
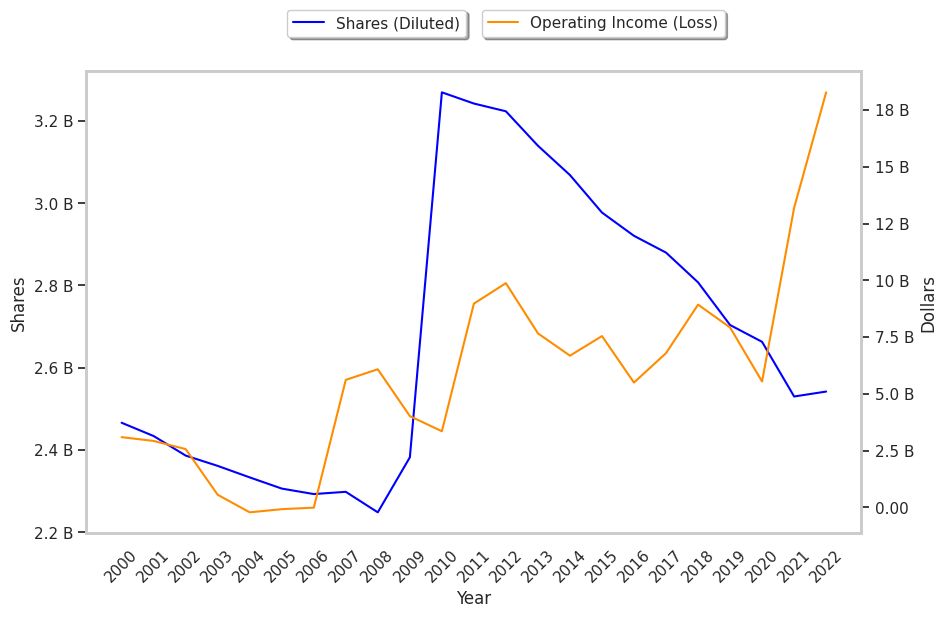
| Diluted Shares (MM) | 2,679 | 2,580 | 2,541 | 2,538 | 2,542 | 2,555 |
| Free Cash Flow (MM) | $8,307 | $10,071 | $5,824 | $8,674 | $14,707 | $14,848 |
| Capital Expenditures (MM) | $2,615 | $3,369 | $4,429 | $4,448 | $4,388 | $4,247 |
| Net Current Assets (MM) | -$9,114 | -$7,398 | -$12,981 | -$3,750 | $2,094 | -$1,583 |
| Long Term Debt (MM) | $19,806 | $22,736 | $25,360 | $30,690 | $28,745 | $34,072 |
| Net Debt / EBITDA | 1.3 | 1.54 | 3.15 | 1.73 | 1.09 | 2.03 |
Merck & Company benefits from growing revenues and increasing reinvestment in the business, a pattern of improving cash flows, and wider gross margins than its peer group. The company's financial statements show decent operating margins with a stable trend and healthy leverage. However, the firm has declining EPS growth.