We've been asking ourselves recently if the market has placed a fair valuation on CVS Health. Let's dive into some of the fundamental values of this large-cap Consumer Staples company to determine if there might be an opportunity here for value-minded investors.
A Lower P/B Ratio Than Its Sector Average but Trades Above Its Graham Number:
CVS Health Corporation provides health services in the United States. The company belongs to the Consumer Staples sector, which has an average price to earnings (P/E) ratio of 24.36 and an average price to book (P/B) ratio of 4.29. In contrast, CVS Health has a trailing 12 month P/E ratio of 10.6 and a P/B ratio of 1.2.
CVS Health's PEG ratio is 2.0, which shows that the stock is probably overvalued in terms of its estimated growth. For reference, a PEG ratio near or below 1 is a potential signal that a company is undervalued.
Growing Revenues With Increasing Reinvestment in the Business:
| 2018 | 2019 | 2020 | 2021 | 2022 | 2023 | |
|---|---|---|---|---|---|---|
| Revenue (MM) | $194,579 | $256,776 | $268,706 | $292,111 | $322,467 | $339,204 |
| Operating Margins | 2% | 5% | 5% | 5% | 2% | 2% |
| Net Margins | 0% | 3% | 3% | 3% | 1% | 1% |
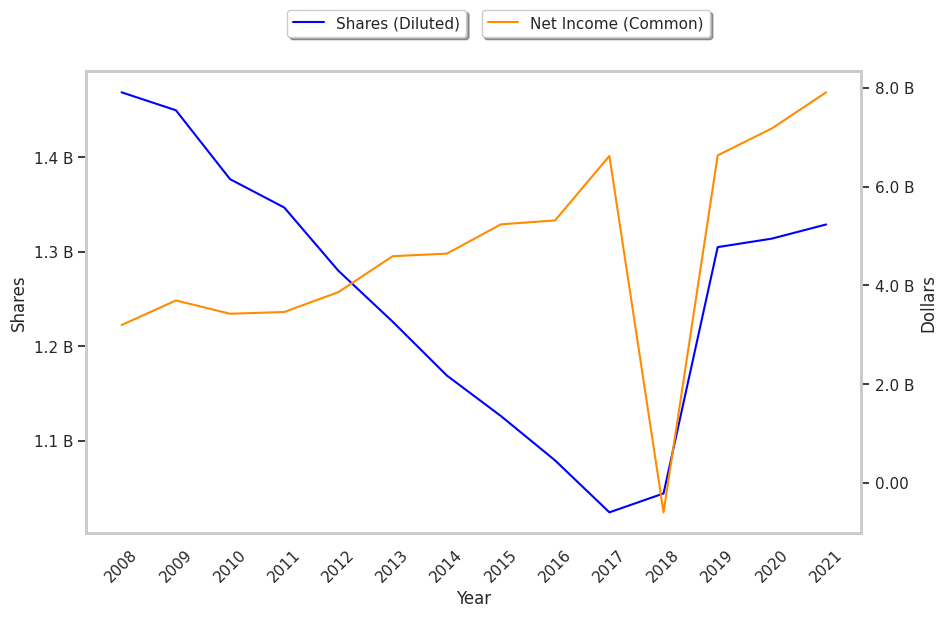
| Net Income (MM) | -$2 | $6,634 | $7,192 | $8,001 | $4,327 | $4,327 |
| Net Interest Expense (MM) | $2,803 | $3,035 | $2,907 | $2,503 | $2,287 | $2,393 |
| Depreciation & Amort. (MM) | $2,718 | $4,371 | $4,441 | $4,486 | $4,224 | $4,198 |
| Earnings Per Share | -$0.57 | $5.08 | $5.46 | $6.02 | $3.26 | $2.33 |
| Diluted Shares (MM) | 1,044 | 1,305 | 1,314 | 1,329 | 1,323 | 1,252 |
| Free Cash Flow (MM) | $6,828 | $10,391 | $13,428 | $15,745 | $13,450 | $17,674 |
| Capital Expenditures (MM) | $2,037 | $2,457 | $2,437 | $2,520 | $2,727 | $2,843 |
| Net Current Assets (MM) | -$92,670 | -$107,977 | -$104,645 | -$98,176 | -$90,873 | -$109,313 |
| Long Term Debt (MM) | $71,444 | $64,699 | $96,646 | $88,585 | $80,355 | $61,419 |
| Net Debt / EBITDA | 13.62 | 5.03 | 6.75 | 5.83 | 7.27 | 7.22 |
CVS Health has growing revenues and increasing reinvestment in the business, exceptional EPS growth, and generally positive cash flows. However, the firm has a highly leveraged balance sheet. Finally, we note that CVS Health has average net margins with a stable trend.