CVS Health shares fell by -2.6% during the day's afternoon session, and are now trading at a price of $67.5. Is it time to buy the dip? To better answer that question, it's essential to check if the market is valuing the company's shares fairly in terms of its earnings and equity levels.
The Market May Be Undervaluing CVS Health's Assets and Equity:
CVS Health Corporation provides health services in the United States. The company belongs to the Consumer Staples sector, which has an average price to earnings (P/E) ratio of 24.36 and an average price to book (P/B) ratio of 4.29. In contrast, CVS Health has a trailing 12 month P/E ratio of 10.3 and a P/B ratio of 1.17.
CVS Health's PEG ratio is 2.0, which shows that the stock is probably overvalued in terms of its estimated growth. For reference, a PEG ratio near or below 1 is a potential signal that a company is undervalued.
Growing Revenues With Increasing Reinvestment in the Business:
| 2018 | 2019 | 2020 | 2021 | 2022 | 2023 | |
|---|---|---|---|---|---|---|
| Revenue (MM) | $194,579 | $256,776 | $268,706 | $292,111 | $322,467 | $347,809 |
| Operating Margins | 2% | 5% | 5% | 5% | 2% | 4% |
| Net Margins | 0% | 3% | 3% | 3% | 1% | 2% |
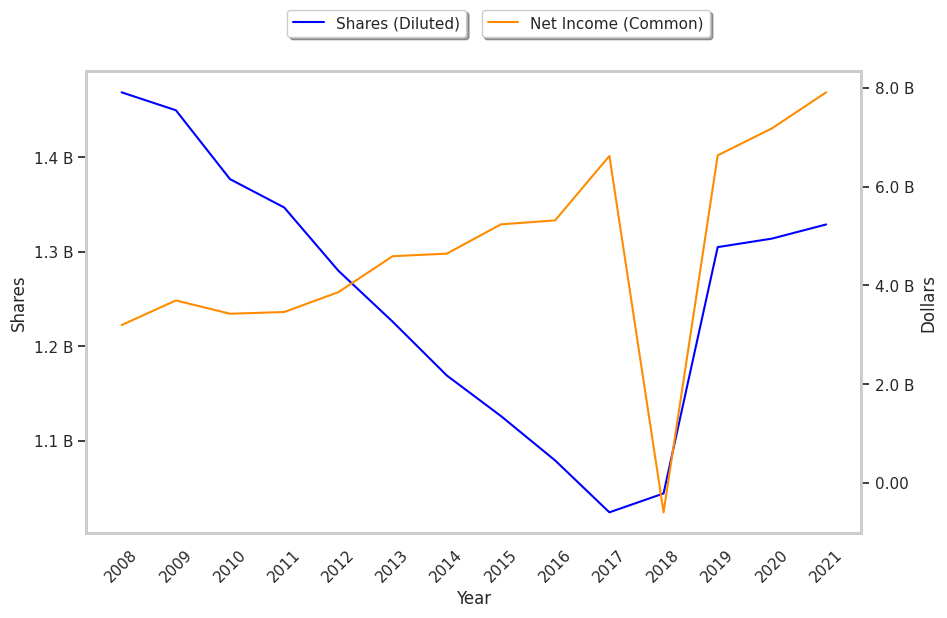
| Net Income (MM) | -$2 | $6,634 | $7,192 | $8,001 | $4,327 | $8,653 |
| Net Interest Expense (MM) | $2,803 | $3,035 | $2,907 | $2,503 | $2,287 | $2,520 |
| Depreciation & Amort. (MM) | $2,718 | $4,371 | $4,441 | $4,486 | $4,224 | $4,275 |
| Earnings Per Share | -$0.57 | $5.08 | $5.46 | $6.02 | $3.26 | $6.67 |
| Diluted Shares (MM) | 1,044 | 1,305 | 1,314 | 1,329 | 1,323 | 1,227 |
| Free Cash Flow (MM) | $6,828 | $10,391 | $13,428 | $15,745 | $13,450 | $11,302 |
| Capital Expenditures (MM) | $2,037 | $2,457 | $2,437 | $2,520 | $2,727 | $2,808 |
| Net Current Assets (MM) | -$92,670 | -$107,977 | -$104,645 | -$98,176 | -$90,873 | -$106,653 |
| Long Term Debt (MM) | $71,444 | $64,699 | $96,646 | $88,585 | $80,355 | $59,782 |
| Net Debt / EBITDA | 13.62 | 5.03 | 6.75 | 5.83 | 7.27 | 4.18 |