Jazz Pharmaceuticals logged a 0.2% change during today's afternoon session, and is now trading at a price of $114.77 per share.
Jazz Pharmaceuticals returned losses of -27.0% last year, with its stock price reaching a high of $160.96 and a low of $111.25. Over the same period, the stock underperformed the S&P 500 index by -40.0%. As of April 2023, the company's 50-day average price was $127.68. Jazz Pharmaceuticals plc, a biopharmaceutical company, identifies, develops, and commercializes pharmaceutical products for unmet medical needs in the United States, Europe, and internationally. Based in Dublin, Ireland, the mid-cap Health Care company has 2,800 full time employees. Jazz Pharmaceuticals has not offered a regular dividend during the last year.
Increasing Revenues but Narrowing Margins:
| 2018 | 2019 | 2020 | 2021 | 2022 | 2023 | |
|---|---|---|---|---|---|---|
| Revenue (MM) | $1,891 | $2,162 | $2,364 | $3,094 | $3,659 | $3,794 |
| Gross Margins | 33% | 25% | 16% | 6% | -2% | 5% |
| Operating Margins | 33% | 25% | 16% | 6% | -2% | 5% |
| Net Margins | 24% | 24% | 10% | -11% | -6% | 2% |
| Net Income (MM) | $447 | $523 | $239 | -$330 | -$224 | $80 |
| Net Interest Expense (MM) | -$78 | -$72 | -$100 | -$279 | -$288 | -$293 |
| Depreciation & Amort. (MM) | $201 | $355 | $260 | $526 | $599 | $594 |
| Earnings Per Share | $7.3 | $9.09 | $4.22 | -$5.52 | -$3.58 | $0.8500000000000001 |
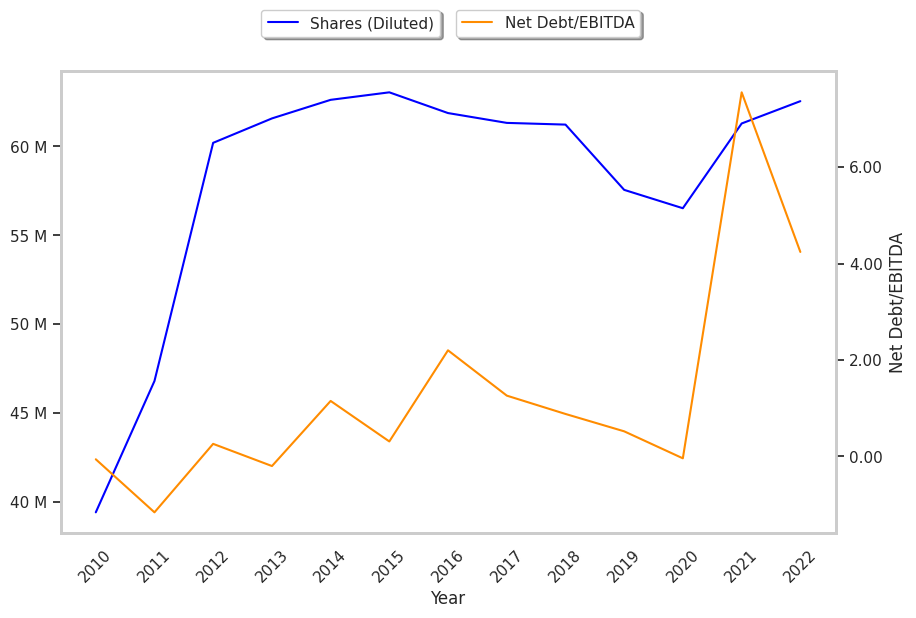
| Diluted Shares (MM) | 61 | 58 | 57 | 60 | 63 | 92 |
| Free Cash Flow (MM) | $779 | $736 | $885 | $751 | $1,243 | $1,243 |
| Capital Expenditures (MM) | $20 | $40 | $15 | $28 | $29 | $23 |
| Net Current Assets (MM) | $587 | $1,108 | $2,006 | $1,629 | $1,562 | $1,541 |
| Long Term Debt (MM) | $1,563 | $1,574 | $1,849 | $6,019 | $5,693 | $5,111 |
| Net Debt / EBITDA | 1.54 | 1.09 | 1.63 | 7.84 | 9.08 | 5.57 |
Jazz Pharmaceuticals has slimmer gross margins than its peers, declining EPS growth, and a highly leveraged balance sheet. On the other hand, the company has growing revenues and a flat capital expenditure trend working in its favor. Furthermore, Jazz Pharmaceuticals has average net margins with a negative growth trend and irregular cash flows.
A Lower P/B Ratio Than Its Sector Average but Trades Above Its Graham Number:
Jazz Pharmaceuticals has a trailing twelve month P/E ratio of 155.7, compared to an average of 24.45 for the Health Care sector. Based on its EPS guidance of $19.85, the company has a forward P/E ratio of 6.4. The company doesn't issue forward earnings guidance, and the compound average growth rate of its last 6 years of reported EPS is -30.1%. On this basis, the company's PEG ratio is -5.17, which indicates that its shares are overpriced. In contrast, the market is likely undervaluing Jazz Pharmaceuticals in terms of its equity because its P/B ratio is 2.07 while the sector average is 4.16. The company's shares are currently trading 260.2% above their Graham number.
Jazz Pharmaceuticals Has an Analyst Consensus of Strong Upside Potential:
The 17 analysts following Jazz Pharmaceuticals have set target prices ranging from $135.0 to $240.0 per share, for an average of $195.0 with a buy rating. As of April 2023, the company is trading -34.5% away from its average target price, indicating that there is an analyst consensus of strong upside potential.
Jazz Pharmaceuticals has an average amount of shares sold short because 4.7% of the company's shares are sold short. Institutions own 93.9% of the company's shares, and the insider ownership rate stands at 2.58%, suggesting a decent amount of insider shareholders. The largest shareholder is Blackrock Inc., whose 11% stake in the company is worth $824,814,874.