Meta Platforms logged a -1.8% change during today's afternoon session, and is now trading at a price of $332.83 per share.
Meta Platforms returned gains of 182.0% last year, with its stock price reaching a high of $342.92 and a low of $109.38. Over the same period, the stock outperformed the S&P 500 index by 170.0%. More recently, the company's 50-day average price was $315.58. Meta Platforms, Inc. engages in the development of products that enable people to connect and share with friends and family through mobile devices, personal computers, virtual reality headsets, and wearables worldwide. Based in Menlo Park, CA, the large-cap Technology company has 66,185 full time employees. Meta Platforms has not offered a dividend during the last year.
Increasing Revenues but Narrowing Margins:
| 2018 | 2019 | 2020 | 2021 | 2022 | 2023 | |
|---|---|---|---|---|---|---|
| Revenue (MM) | $55,838 | $70,697 | $85,965 | $117,929 | $116,609 | $126,955 |
| Gross Margins | 45% | 34% | 38% | 40% | 25% | 28% |
| Operating Margins | 45% | 35% | 39% | 40% | 25% | 28% |
| Net Margins | 40% | 26% | 34% | 33% | 20% | 23% |
| Net Income (MM) | $22,112 | $18,485 | $29,146 | $39,370 | $23,200 | $29,733 |
| Net Interest Expense (MM) | $448 | $826 | $672 | $531 | $276 | $276 |
| Depreciation & Amort. (MM) | $4,315 | $5,741 | $6,862 | $7,967 | $8,686 | $10,382 |
| Earnings Per Share | $7.57 | $6.43 | $10.09 | $13.77 | $8.59 | $11.34 |
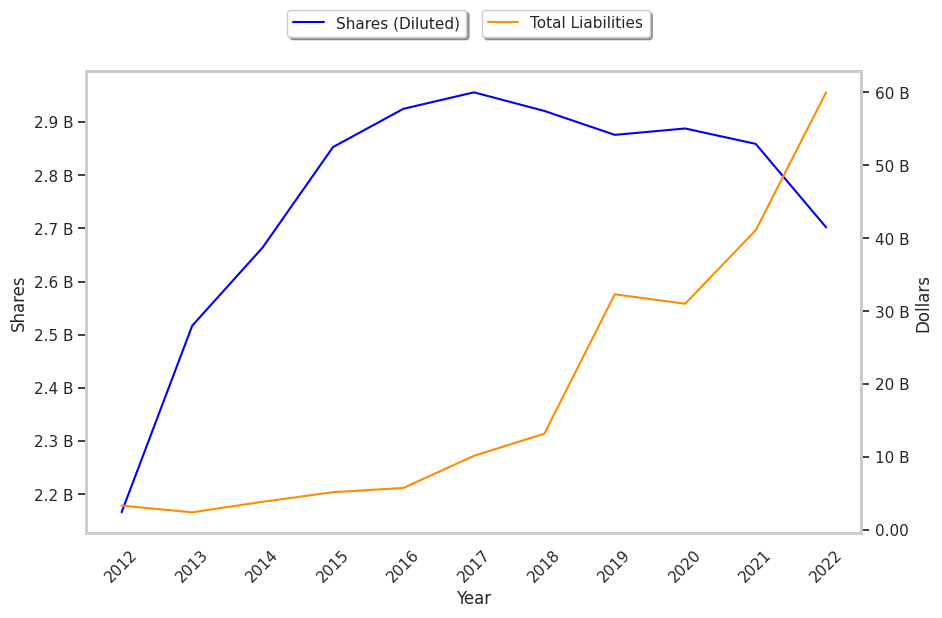
| Diluted Shares (MM) | 2,921 | 2,876 | 2,888 | 2,859 | 2,702 | 2,409 |
| Free Cash Flow (MM) | $15,359 | $21,212 | $23,584 | $38,993 | $19,044 | $37,576 |
| Capital Expenditures (MM) | $13,915 | $15,102 | $15,163 | $18,690 | $31,431 | $28,644 |
| Net Current Assets (MM) | n/a | $33,903 | n/a | $25,558 | -$465 | $4,977 |
| Long Term Debt (MM) | n/a | $7,137 | n/a | $870 | $9,923 | $18,383 |
| Net Debt / EBITDA | nan | -0.39 | -0.44 | -0.28 | -0.12 | -0.39 |
Meta Platforms has growing revenues and increasing reinvestment in the business and low leverage. Additionally, the company's financial statements display decent operating margins with a negative growth trend and positive EPS growth. However, the firm has slimmer gross margins than its peers. Finally, we note that Meta Platforms has irregular cash flows.
Meta Platforms's Valuation Is in Line With Its Sector Averages:
Meta Platforms has a trailing twelve month P/E ratio of 27.9, compared to an average of 27.16 for the Technology sector. Based on its EPS guidance of $15.87, the company has a forward P/E ratio of 19.9. The company doesn't issue forward earnings guidance, and the compound average growth rate of its last 6 years of reported EPS is 7.0%. On this basis, the company's PEG ratio is 4.0, which suggests that it is overpriced. In contrast, the market is likely undervaluing Meta Platforms in terms of its equity because its P/B ratio is 5.99 while the sector average is 6.23. The company's shares are currently trading 168.4% above their Graham number.
Analysts Give Meta Platforms an Average Rating of Buy:
The 50 analysts following Meta Platforms have set target prices ranging from $175.0 to $435.0 per share, for an average of $372.4 with a buy rating. As of April 2023, the company is trading -15.3% away from its average target price, indicating that there is an analyst consensus of some upside potential.
Meta Platforms has a very low short interest because 1.4% of the company's shares are sold short. Institutions own 76.3% of the company's shares, and the insider ownership rate stands at 0.23%, suggesting a small amount of insider investors. The largest shareholder is Vanguard Group Inc, whose 8% stake in the company is worth $60,989,362,992.