Now trading at a price of $4.68, Sirius XM has moved -1.4% so far today.
Sirius XM returned losses of -27.0% last year, with its stock price reaching a high of $7.95 and a low of $3.32. Over the same period, the stock underperformed the S&P 500 index by -40.0%. As of April 2023, the company's 50-day average price was $4.55. Sirius XM Holdings Inc., an audio entertainment company, operates audio business including subscription entertainment services in the United States. Based in New York, NY, the large-cap Consumer Discretionary company has 5,869 full time employees. Sirius XM has offered a 2.0% dividend yield over the last 12 months.
EPS Trend Sustained Primarily by Reducing the Number of Shares Outstanding:
| 2018 | 2019 | 2020 | 2021 | 2022 | 2023 | |
|---|---|---|---|---|---|---|
| Revenue (MM) | $5,771 | $7,794 | $8,040 | $8,696 | $9,003 | $8,949 |
| Gross Margins | 30% | 21% | 11% | 23% | 23% | 23% |
| Operating Margins | 30% | 21% | 11% | 23% | 23% | 23% |
| Net Margins | 20% | 12% | 2% | 15% | 14% | 14% |
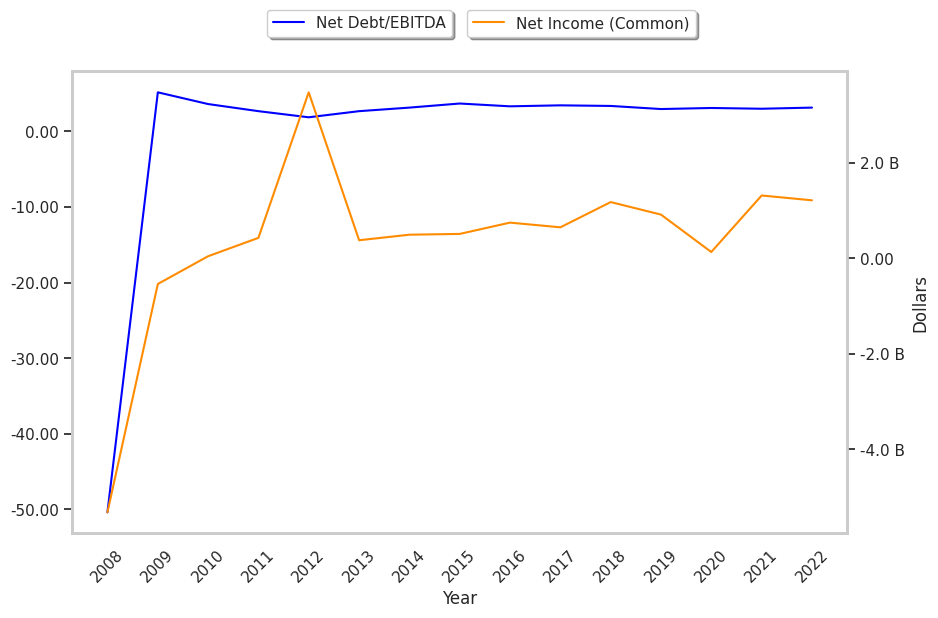
| Net Income (MM) | $1,176 | $921 | $139 | $1,322 | $1,217 | $1,272 |
| Net Interest Expense (MM) | $350 | $390 | $394 | $415 | $422 | $428 |
| Depreciation & Amort. (MM) | $301 | $468 | $506 | $533 | $536 | $537 |
| Earnings Per Share | $0.26 | $0.2 | $0.03 | $0.32 | $0.31 | $0.3299999999999999 |
| Diluted Shares (MM) | 4,561 | 4,616 | 4,429 | 4,143 | 3,990 | 3,670 |
| Free Cash Flow (MM) | $1,525 | $1,654 | $1,668 | $1,610 | $1,550 | $1,288 |
| Capital Expenditures (MM) | $355 | $363 | $350 | $388 | $426 | $667 |
| Net Current Assets (MM) | -$9,512 | -$10,882 | -$11,651 | -$11,719 | -$12,335 | -$11,981 |
| Long Term Debt (MM) | $6,885 | $7,842 | $8,499 | $8,832 | $9,256 | $8,823 |
| Net Debt / EBITDA | 3.36 | 3.65 | 6.17 | 3.39 | 3.65 | 3.64 |
Sirius XM's financial statements include several red flags such as slimmer gross margins than its peers, EPS growth achieved by reducing the number of outstanding shares, and a deteriorating pattern of cash flows. Additionally, the firm has a highly leveraged balance sheet. On the other hand, the company benefits from growing revenues and increasing reinvestment in the business and decent operating margins with a stable trend.
Sirius XM Is Overpriced:
Sirius XM has a trailing twelve month P/E ratio of 14.2, compared to an average of 22.33 for the Consumer Discretionary sector. Based on its EPS guidance of $0.31, the company has a forward P/E ratio of 14.7. The company doesn't issue forward earnings guidance, and the compound average growth rate of its last 6 years of reported EPS is 4.1%. On this basis, the company's PEG ratio is 3.51, which suggests that it is overpriced.
Sirius XM Has an Average Rating of Hold:
The 10 analysts following Sirius XM have set target prices ranging from $3.5 to $7.0 per share, for an average of $4.84 with a hold rating. As of April 2023, the company is trading -6.0% away from its average target price, indicating that there is an analyst consensus of some upside potential.
Sirius XM has an unusually large proportion of its shares sold short because 29.1% of the company's shares are sold short. Institutions own 12.9% of the company's shares, and the insider ownership rate stands at 83.6%, suggesting a large amount of insider shareholders. The largest shareholder is Vanguard Group Inc, whose 1% stake in the company is worth $254,482,553.