Today we're going to take a closer look at large-cap Health Care company Humana, whose shares are currently trading at $484.86. We've been asking ourselves whether the company is under or over valued at today's prices... let's perform a brief value analysis to find out!
Humana's Valuation Is in Line With Its Sector Averages:
Humana Inc., together with its subsidiaries, operates as a health and well-being company in the United States. The company belongs to the Health Care sector, which has an average price to earnings (P/E) ratio of 24.45 and an average price to book (P/B) ratio of 4.16. In contrast, Humana has a trailing 12 month P/E ratio of 20.1 and a P/B ratio of 3.52.
Humana's PEG ratio is 1.24, which shows that the stock is probably overvalued in terms of its estimated growth. For reference, a PEG ratio near or below 1 is a potential signal that a company is undervalued.
Growing Revenues With Increasing Reinvestment in the Business:
| 2018 | 2019 | 2020 | 2021 | 2022 | 2023 | |
|---|---|---|---|---|---|---|
| Revenue (MM) | $56,912 | $64,888 | $77,155 | $83,064 | $92,870 | $102,351 |
| Operating Margins | 5% | 5% | 6% | 4% | 4% | 4% |
| Net Margins | 3% | 4% | 4% | 4% | 3% | 3% |
| Net Income (MM) | $1,683 | $2,707 | $3,367 | $2,934 | $2,806 | $3,015 |
| Net Interest Expense (MM) | $218 | $506 | $283 | $532 | $401 | $455 |
| Depreciation & Amort. (MM) | $444 | $505 | $528 | $640 | $749 | $822 |
| Earnings Per Share | $12.16 | $20.1 | $25.31 | $22.67 | $22.08 | $24.16 |
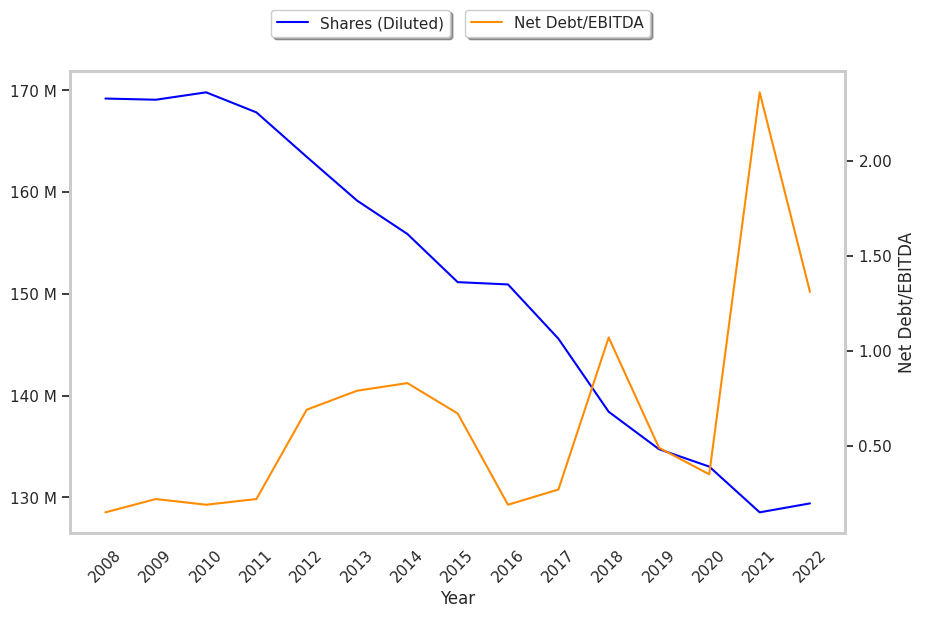
| Diluted Shares (MM) | 138 | 135 | 133 | 129 | 127 | 120 |
| Free Cash Flow (MM) | $1,561 | $4,548 | $4,675 | $946 | $3,467 | $5,009 |
| Capital Expenditures (MM) | $612 | $736 | $964 | $1,316 | $1,120 | $979 |
| Net Current Assets (MM) | $1,696 | $2,851 | $2,400 | -$3,362 | -$1,502 | -$648 |
| Long Term Debt (MM) | $4,375 | $4,967 | $6,060 | $10,541 | $9,034 | $9,483 |
| Net Debt / EBITDA | 1.89 | 1.32 | 1.06 | 3.37 | 2.26 | -0.64 |
Humana has growing revenues and increasing reinvestment in the business and low leverage. Additionally, the company's financial statements display a strong EPS growth trend and generally positive cash flows. However, the firm has weak operating margins with a stable trend.