Selective Insurance logged a 2.7% change during today's evening session, and is now trading at a price of $101.69 per share.
Selective Insurance returned gains of 8.0% last year, with its stock price reaching a high of $108.18 and a low of $84.47. Over the same period, the stock underperformed the S&P 500 index by -5.0%. As of April 2023, the company's 50-day average price was $103.56. Selective Insurance Group, Inc., together with its subsidiaries, provides insurance products and services in the United States. Based in Branchville, NJ, the mid-cap Finance company has 2,520 full time employees. Selective Insurance has offered a 1.2% dividend yield over the last 12 months.
The Company May Be Profitable, but Its Balance Sheet Is Highly Leveraged:
| 2018 | 2019 | 2020 | 2021 | 2022 | 2023 | |
|---|---|---|---|---|---|---|
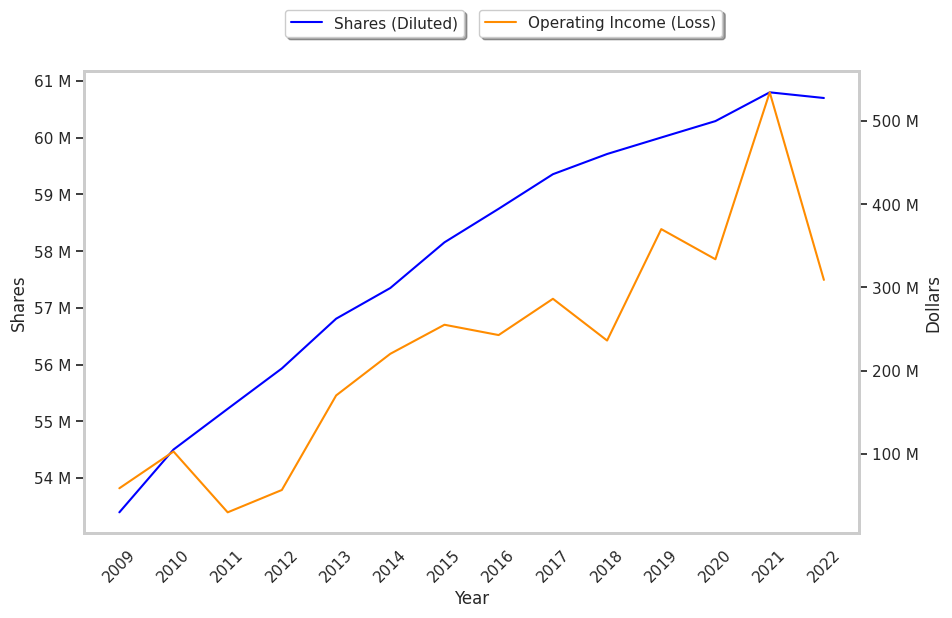
| Revenue (MM) | $2,586 | $2,846 | $2,922 | $3,379 | $3,558 | $4,074 |
| Interest Income (MM) | $24 | $34 | $31 | $29 | $29 | $29 |
| Operating Margins | 8% | 12% | 10% | 15% | 8% | 10% |
| Net Margins | 7% | 10% | 8% | 12% | 6% | 8% |
| Net Income (MM) | $179 | $272 | $246 | $404 | $225 | $327 |
| Depreciation & Amort. (MM) | $45 | $55 | $59 | $55 | $42 | $31 |
| Earnings Per Share | $3.0 | $4.53 | $4.09 | $6.5 | $3.54 | $5.199999999999999 |
| Diluted Shares (MM) | 60 | 60 | 60 | 0 | 61 | 61 |
| Free Cash Flow (MM) | $439 | $454 | $532 | $749 | $776 | $820 |
| Capital Expenditures (MM) | $16 | $23 | $22 | $22 | $26 | $19 |
| Net Current Assets (MM) | -$200 | $86 | $557 | $548 | -$437 | -$588 |
| Long Term Debt (MM) | $6,161 | $6,602 | $6,934 | $7,451 | $8,248 | $8,757 |
| Net Debt / EBITDA | 23.95 | 16.84 | 19.1 | 13.22 | 25.5 | 19.82 |
Selective Insurance has growing revenues and a flat capital expenditure trend and a pattern of improving cash flows. Additionally, the company's financial statements display decent operating margins with a stable trend and positive EPS growth. However, the firm has a highly leveraged balance sheet.
Selective Insurance's Valuation Is in Line With Its Sector Averages:
Selective Insurance has a trailing twelve month P/E ratio of 19.9, compared to an average of 14.34 for the Finance sector. Based on its EPS guidance of $7.77, the company has a forward P/E ratio of 13.3. The company doesn't issue forward earnings guidance, and the compound average growth rate of its last 6 years of reported EPS is 9.6%. On this basis, the company's PEG ratio is 2.07, which suggests that it is overpriced. Furthermore, Selective Insurance is likely overvalued compared to the book value of its equity, since its P/B ratio of 2.52 is higher than the sector average of 1.57. The company's shares are currently trading 42.5% above their Graham number.
Selective Insurance Has an Average Rating of Hold:
The 7 analysts following Selective Insurance have set target prices ranging from $93.0 to $120.0 per share, for an average of $107.14 with a hold rating. As of April 2023, the company is trading -3.3% away from its average target price, indicating that there is an analyst consensus of some upside potential.
Selective Insurance has an average amount of shares sold short because 2.5% of the company's shares are sold short. Institutions own 88.1% of the company's shares, and the insider ownership rate stands at 1.6%, suggesting a small amount of insider investors. The largest shareholder is Blackrock Inc., whose 12% stake in the company is worth $748,502,075.