We've been asking ourselves recently if the market has placed a fair valuation on Apple. Let's dive into some of the fundamental values of this large-cap Technology company to determine if there might be an opportunity here for value-minded investors.
Apple's Valuation Is in Line With Its Sector Averages:
Apple Inc. designs, manufactures, and markets smartphones, personal computers, tablets, wearables, and accessories worldwide. The company belongs to the Technology sector, which has an average price to earnings (P/E) ratio of 27.16 and an average price to book (P/B) ratio of 6.23. In contrast, Apple has a trailing 12 month P/E ratio of 31.1 and a P/B ratio of 47.85.
Apple's PEG ratio is 4.72, which shows that the stock is probably overvalued in terms of its estimated growth. For reference, a PEG ratio near or below 1 is a potential signal that a company is undervalued.
Wider Gross Margins Than the Industry Average of 36.39%:
| 2018 | 2019 | 2020 | 2021 | 2022 | 2023 | |
|---|---|---|---|---|---|---|
| Revenue (MM) | $265,595 | $260,174 | $274,515 | $365,817 | $394,328 | $383,285 |
| Gross Margins | 38% | 38% | 38% | 42% | 43% | 44% |
| Operating Margins | 27% | 25% | 24% | 30% | 30% | 30% |
| Net Margins | 22% | 21% | 21% | 26% | 25% | 25% |
| Net Income (MM) | $59,531 | $55,256 | $57,411 | $94,680 | $99,803 | $96,995 |
| Net Interest Expense (MM) | $3,240 | $3,576 | $2,873 | $2,645 | $2,931 | $3,933 |
| Depreciation & Amort. (MM) | $10,903 | $12,547 | $11,056 | $11,284 | $11,104 | $11,519 |
| Earnings Per Share | $2.98 | $2.97 | $3.28 | $5.61 | $6.11 | $6.13 |
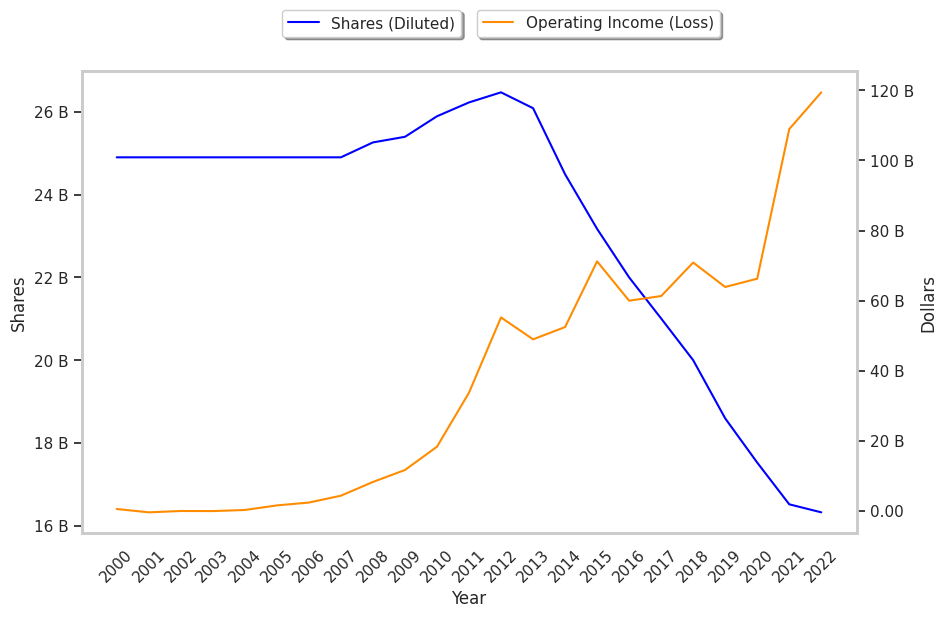
| Diluted Shares (MM) | 20,000 | 18,596 | 17,528 | 16,865 | 16,326 | 15,813 |
| Free Cash Flow (MM) | $64,121 | $58,896 | $73,365 | $92,953 | $111,443 | $99,584 |
| Capital Expenditures (MM) | $13,313 | $10,495 | $7,309 | $11,085 | $10,708 | $10,959 |
| Net Current Assets (MM) | -$114,999 | -$87,856 | -$133,724 | -$156,105 | -$161,243 | -$146,871 |
| Long Term Debt (MM) | $28,296 | $36,682 | $42,941 | $51,573 | $99,627 | $45,433 |
| Net Debt / EBITDA | 0.34 | 0.37 | 0.48 | 0.35 | 0.69 | 0.25 |
Apple benefits from low leverage, growing revenues and decreasing reinvestment in the business, and wider gross margins than its peer group. The company's financial statements show decent operating margins with a stable trend and a strong EPS growth trend. Furthermore, Apple has irregular cash flows.