Now trading at a price of $136.17, Quest Diagnostics has moved -0.8% so far today.
Quest Diagnostics returned losses of -9.0% last year, with its stock price reaching a high of $158.34 and a low of $119.59. Over the same period, the stock underperformed the S&P 500 index by -23.0%. As of April 2023, the company's 50-day average price was $128.51. Quest Diagnostics Incorporated provides diagnostic testing, information, and services in the United States and internationally. Based in Secaucus, NJ, the large-cap Health Care company has 50,000 full time employees. Quest Diagnostics has offered a 2.0% dividend yield over the last 12 months.
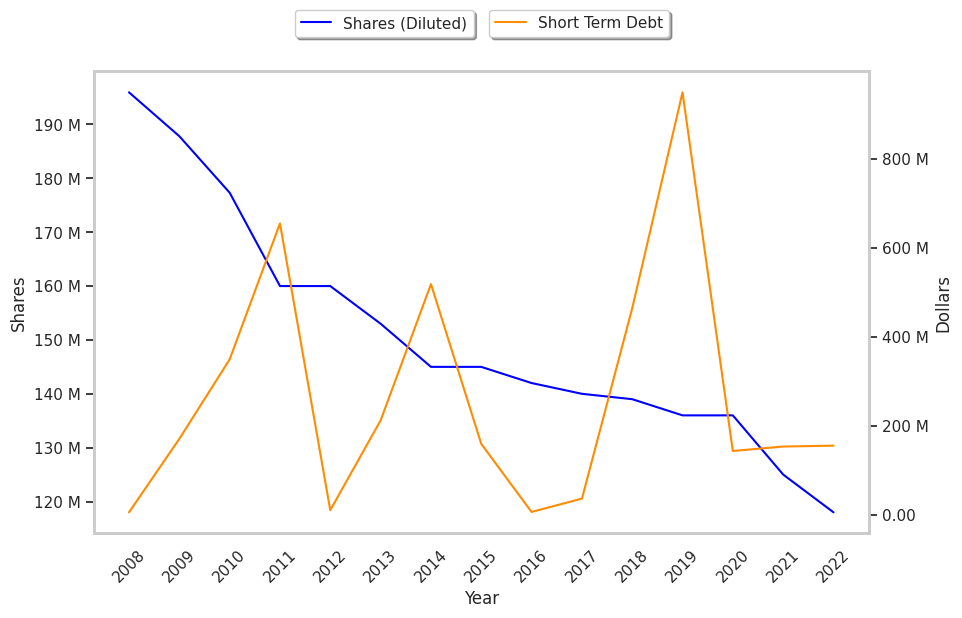
EPS Trend Sustained Primarily by Reducing the Number of Shares Outstanding:
| 2018 | 2019 | 2020 | 2021 | 2022 | 2023 | |
|---|---|---|---|---|---|---|
| Revenue (MM) | $7,531 | $7,726 | $9,437 | $10,788 | $9,883 | $9,297 |
| Operating Margins | 15% | 16% | 21% | 24% | 14% | 12% |
| Net Margins | 10% | 12% | 16% | 19% | 10% | 9% |
| Net Income (MM) | $788 | $906 | $1,499 | $2,080 | $1,015 | $819 |
| Net Interest Expense (MM) | $169 | $180 | $166 | $369 | $148 | $153 |
| Depreciation & Amort. (MM) | $309 | $329 | $361 | $408 | $437 | $446 |
| Earnings Per Share | $5.29 | $6.28 | $10.47 | $15.55 | $7.97 | $6.71 |
| Diluted Shares (MM) | 139 | 136 | 136 | 128 | 118 | 101 |
| Free Cash Flow (MM) | $817 | $843 | $1,587 | $1,830 | $1,314 | $596 |
| Capital Expenditures (MM) | $383 | $400 | $418 | $403 | $404 | $483 |
| Net Current Assets (MM) | -$840 | -$211 | $435 | $196 | -$465 | -$677 |
| Long Term Debt (MM) | $3,429 | $3,966 | $4,013 | $4,010 | $3,978 | $3,946 |
| Net Debt / EBITDA | 3.39 | 2.96 | 1.93 | 1.58 | 2.71 | 3.34 |
Quest Diagnostics has average net margins with a stable trend, irregular cash flows, and significant leverage. We also note that the company has growing revenues and increasing reinvestment in the business working in its favor. However, the firm has EPS growth achieved by reducing the number of outstanding shares.
A Lower P/B Ratio Than Its Sector Average but Trades Above Its Graham Number:
Quest Diagnostics has a trailing twelve month P/E ratio of 19.2, compared to an average of 24.45 for the Health Care sector. Based on its EPS guidance of $9.03, the company has a forward P/E ratio of 14.2. The company doesn't issue forward earnings guidance, and the compound average growth rate of its last 6 years of reported EPS is 4.0%. On this basis, the company's PEG ratio is 4.74, which suggests that it is overpriced. In contrast, the market is likely undervaluing Quest Diagnostics in terms of its equity because its P/B ratio is 2.37 while the sector average is 4.16. The company's shares are currently trading 38.0% above their Graham number.
Quest Diagnostics Has an Average Rating of Hold:
The 14 analysts following Quest Diagnostics have set target prices ranging from $130.0 to $165.0 per share, for an average of $142.64 with a hold rating. As of April 2023, the company is trading -9.9% away from its average target price, indicating that there is an analyst consensus of some upside potential.
Quest Diagnostics has an average amount of shares sold short because 3.1% of the company's shares are sold short. Institutions own 92.9% of the company's shares, and the insider ownership rate stands at 0.84%, suggesting a small amount of insider investors. The largest shareholder is Vanguard Group Inc, whose 12% stake in the company is worth $1,855,197,893.