We've been asking ourselves recently if the market has placed a fair valuation on Howmet Aerospace. Let's dive into some of the fundamental values of this large-cap Industrials company to determine if there might be an opportunity here for value-minded investors.
Howmet Aerospace's P/B and P/E Ratios Are Higher Than Average:
Howmet Aerospace Inc. provides advanced engineered solutions for the aerospace and transportation industries in the United States, Japan, France, Germany, the United Kingdom, Mexico, Italy, Canada, Poland, China, and internationally. The company belongs to the Industrials sector, which has an average price to earnings (P/E) ratio of 20.49 and an average price to book (P/B) ratio of 3.78. In contrast, Howmet Aerospace has a trailing 12 month P/E ratio of 34.4 and a P/B ratio of 5.71.
Howmet Aerospace's PEG ratio is 1.38, which shows that the stock is probably overvalued in terms of its estimated growth. For reference, a PEG ratio near or below 1 is a potential signal that a company is undervalued.
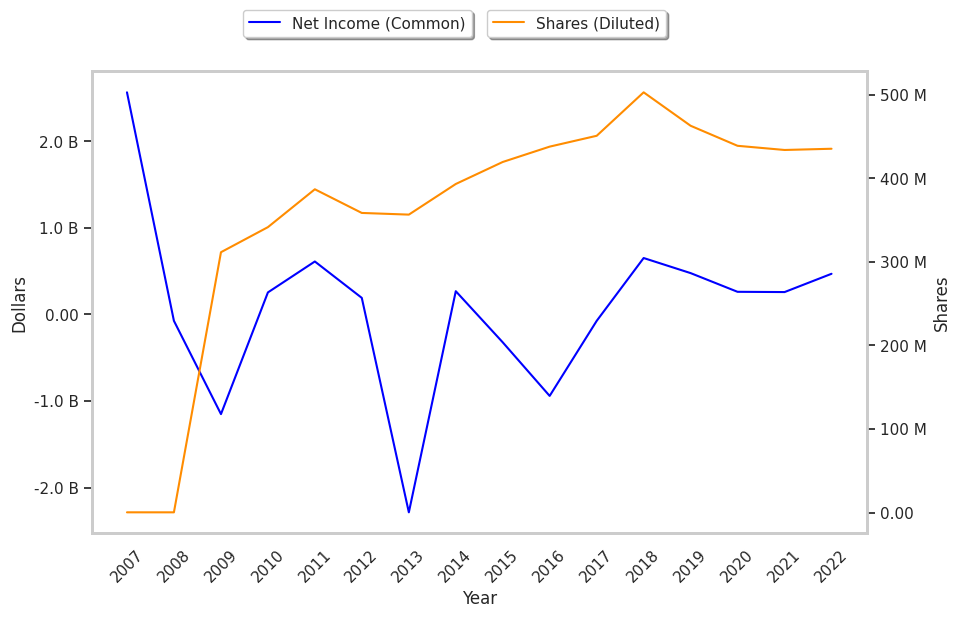
EPS Trend Sustained Primarily by Reducing the Number of Shares Outstanding:
| 2018 | 2019 | 2020 | 2021 | 2022 | 2023 | |
|---|---|---|---|---|---|---|
| Revenue (MM) | $6,778 | $7,098 | $5,259 | $4,972 | $5,663 | $6,422 |
| Gross Margins | -68% | 27% | 26% | 28% | 28% | 28% |
| Operating Margins | 13% | 8% | 12% | 15% | 16% | 17% |
| Net Margins | 10% | 7% | 5% | 5% | 8% | 10% |
| Net Income (MM) | $651 | $477 | $261 | $258 | $469 | $640 |
| Net Interest Expense (MM) | $38 | $338 | $317 | $259 | $229 | $223 |
| Depreciation & Amort. (MM) | $576 | $536 | $338 | $270 | $265 | $271 |
| Free Cash Flow (MM) | -$551 | $461 | -$258 | $250 | $540 | $689 |
| Capital Expenditures (MM) | $768 | n/a | $267 | $199 | $193 | $209 |
| Net Current Assets (MM) | -$6,527 | -$7,114 | -$4,194 | -$3,974 | -$3,511 | -$3,183 |
| Long Term Debt (MM) | $5,896 | $7,704 | $4,699 | $4,227 | $4,162 | $3,989 |
| Net Debt / EBITDA | 2.81 | 7.8 | 3.59 | 3.52 | 2.91 | 2.65 |
Howmet Aerospace suffers from weak revenue growth and decreasing reinvestment in the business, slimmer gross margins than its peers, and weak operating margins with a stable trend. The firm's financial statements also exhibit EPS growth achieved by reducing the number of outstanding shares and a highly leveraged balance sheet. On the other hand, the company has a pattern of improving cash flows working in its favor.