We've been asking ourselves recently if the market has placed a fair valuation on Marathon Petroleum. Let's dive into some of the fundamental values of this large-cap Energy company to determine if there might be an opportunity here for value-minded investors.
Marathon Petroleum Is Currently Undervalued:
Marathon Petroleum Corporation, together with its subsidiaries, operates as an integrated downstream energy company primarily in the United States. The company belongs to the Energy sector, which has an average price to earnings (P/E) ratio of 8.53 and an average price to book (P/B) ratio of 1.78. In contrast, Marathon Petroleum has a trailing 12 month P/E ratio of 5.7 and a P/B ratio of 2.26.
When we divide Marathon Petroleum's P/E ratio by its expected EPS growth rate of the next five years, we obtain its PEG ratio of -0.44. Since it's negative, the company has negative growth expectations, and most investors will probably avoid the stock unless it has an exceptionally low P/E and P/B ratio.
The Business Has Weak Operating Margins:
| 2018 | 2019 | 2020 | 2021 | 2022 | 2023 | |
|---|---|---|---|---|---|---|
| Revenue (MM) | $86,086 | $111,148 | $69,779 | $119,983 | $177,453 | $151,937 |
| Revenue Growth | n/a | 29.11% | -37.22% | 71.95% | 47.9% | -14.38% |
| Gross Margins | 5% | 3% | -16% | 3% | 11% | 10% |
| Operating Margins | 5% | 4% | -18% | 4% | 12% | 11% |
| Net Margins | 4% | 3% | -14% | 9% | 9% | 9% |
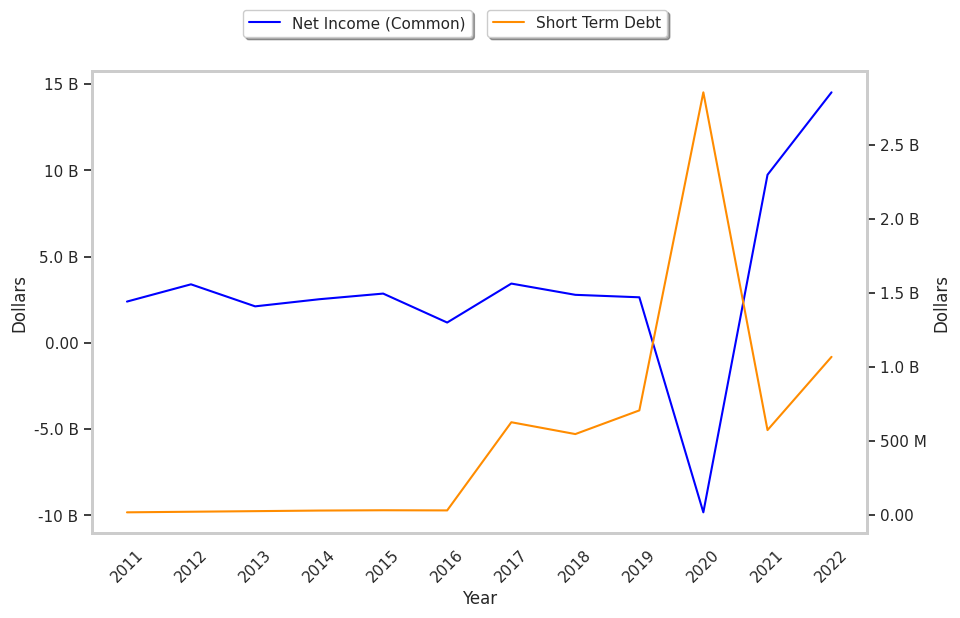
| Net Income (MM) | $3,606 | $3,255 | -$9,826 | $11,001 | $16,050 | $12,936 |
| Net Interest Expense (MM) | $993 | $1,229 | $1,365 | $1,483 | $1,000 | $600 |
| Depreciation & Amort. (MM) | $2,170 | $3,225 | $3,375 | $3,364 | $3,215 | $3,276 |
| Earnings Per Share | $5.28 | $3.97 | -$15.13 | $15.24 | $28.12 | $26.31 |
| EPS Growth | n/a | -24.81% | -481.11% | 200.73% | 84.51% | -6.44% |
| Diluted Shares (MM) | 526 | 664 | 649 | 638 | 516 | 180 |
| Free Cash Flow (MM) | $2,979 | $4,631 | -$368 | $6,920 | $13,941 | $17,720 |
| Capital Expenditures (MM) | $3,179 | $4,810 | $2,787 | $1,464 | $2,420 | $2,084 |
| Current Ratio | 1.36 | 1.8 | 1.81 | 1.7 | 1.76 | 1.67 |
| Long Term Debt (MM) | $26,980 | $28,020 | $28,730 | $24,968 | $25,634 | $26,463 |
| Net Debt / EBITDA | 3.77 | 3.85 | -3.78 | 2.7 | 0.74 | 0.94 |
Marathon Petroleum has exceptional EPS growth and a pattern of improving cash flows. Additionally, the company's financial statements display low leverage and growing revenues and decreasing reinvestment in the business. However, the firm suffers from slimmer gross margins than its peers and weak operating margins with a positive growth rate.