A strong performer from today's overnight trading session is MarketAxess, whose shares rose 5.3% to $251.27 per share. For those of you thinking about investing in the stock, here is a brief value analysis of the stock using the company's basic fundamental ratios.
MarketAxess's P/B and P/E Ratios Are Higher Than Average:
MarketAxess Holdings Inc., together with its subsidiaries, operates an electronic trading platform for institutional investor and broker-dealer companies worldwide. The company belongs to the Finance sector, which has an average price to earnings (P/E) ratio of 12.38 and an average price to book (P/B) ratio of 1.58. In contrast, MarketAxess has a trailing 12 month P/E ratio of 38.2 and a P/B ratio of 7.95.
MarketAxess's PEG ratio is 3.82, which shows that the stock is probably overvalued in terms of its estimated growth. For reference, a PEG ratio near or below 1 is a potential signal that a company is undervalued.
The Business Has Operating Margins Consistently Higher Than the 0.41% industry Average:
| 2018 | 2019 | 2020 | 2021 | 2022 | 2023 | |
|---|---|---|---|---|---|---|
| Revenue (k) | $435,565 | $511,352 | $689,125 | $698,951 | $718,300 | $733,201 |
| Revenue Growth | n/a | 17.4% | 34.77% | 1.43% | 2.77% | 2.07% |
| Interest Income (k) | $5,502 | $6,542 | -$369 | $842 | $11,412 | $12,651 |
| Operating Margins | 50% | 50% | 54% | 48% | 47% | 45% |
| Net Margins | 40% | 40% | 43% | 37% | 35% | 34% |
| Net Income (k) | $172,852 | $204,902 | $299,377 | $257,888 | $250,224 | $247,654 |
| Depreciation & Amort. (k) | $23,080 | $26,857 | $35,996 | $53,447 | $61,446 | $66,757 |
| Earnings Per Share | $4.57 | $5.4 | $7.85 | $6.77 | $6.65 | $6.59 |
| EPS Growth | n/a | 18.16% | 45.37% | -13.76% | -1.77% | -0.9% |
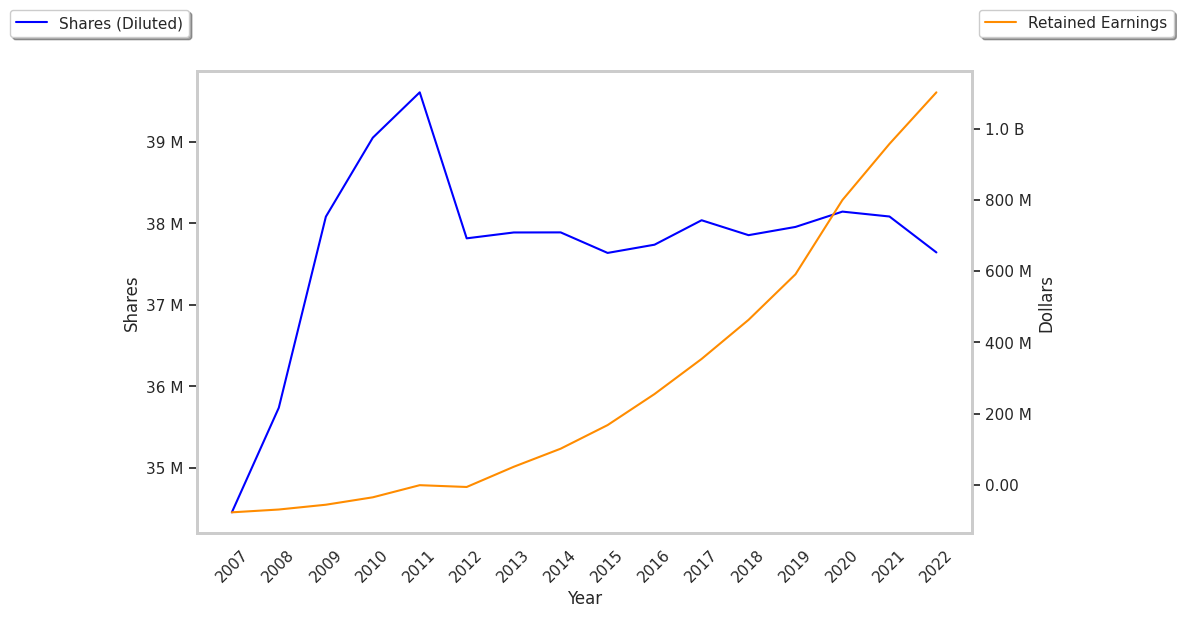
| Diluted Shares (k) | 37,855 | 37,956 | 38,144 | 38,097 | 37,643 | 37,451 |
| Free Cash Flow (k) | $188,029 | $253,643 | $389,479 | $264,598 | $276,089 | $312,553 |
| Capital Expenditures | $35,888 | $12,292 | $15,010 | $17,493 | $13,142 | $13,755 |
| Long Term Debt (k) | $0 | $0 | $0 | $0 | $0 | $0 |
MarketAxess has strong margins with a stable trend, growing revenues and decreasing reinvestment in the business, and positive EPS growth. Furthermore, MarketAxess has irregular cash flows.