Now trading at a price of $116.82, Advanced Micro Devices has moved -1.3% so far today.
Advanced Micro Devices returned gains of 67.0% last year, with its stock price reaching a high of $132.83 and a low of $60.05. Over the same period, the stock outperformed the S&P 500 index by 50.0%. More recently, the company's 50-day average price was $109.67. Advanced Micro Devices, Inc. operates as a semiconductor company worldwide. Based in Santa Clara, CA, the large-cap Technology company has 25,000 full time employees. Advanced Micro Devices has not offered a dividend during the last year.
Growing Revenues With Increasing Reinvestment in the Business:
| 2018 | 2019 | 2020 | 2021 | 2022 | 2023 | |
|---|---|---|---|---|---|---|
| Revenue (MM) | $6,475 | $6,731 | $9,763 | $16,434 | $23,601 | $22,111 |
| Revenue Growth | n/a | 3.95% | 45.05% | 68.33% | 43.61% | -6.31% |
| Gross Margins | 38% | 43% | 45% | 48% | 45% | 45% |
| Operating Margins | 7% | 9% | 14% | 22% | 5% | 5% |
| Net Margins | 5% | 5% | 26% | 19% | 6% | 1% |
| Net Income (MM) | $337 | $341 | $2,490 | $3,162 | $1,320 | $208 |
| Net Interest Expense (MM) | $121 | $94 | $47 | $55 | $88 | $180 |
| Depreciation & Amort. (MM) | $170 | $222 | $312 | $407 | $4,174 | $4,216 |
| Earnings Per Share | $0.32 | $0.3 | $2.06 | $2.57 | $0.84 | $0.08 |
| EPS Growth | n/a | -6.25% | 586.67% | 24.76% | -67.32% | -90.48% |
| Diluted Shares (MM) | 1,064 | 1,120 | 1,207 | 1,229 | 1,571 | 1,771 |
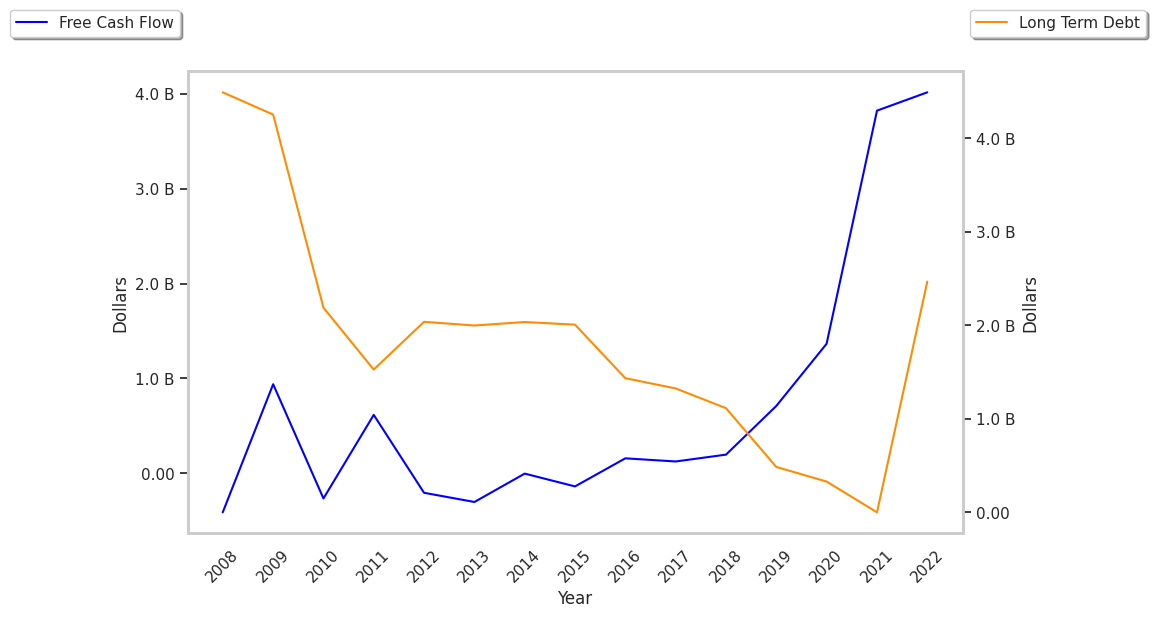
| Free Cash Flow (MM) | -$129 | $276 | $777 | $3,220 | $3,115 | $1,322 |
| Capital Expenditures (MM) | $163 | $217 | $294 | $301 | $450 | $531 |
| Current Ratio | 1.78 | 1.95 | 2.54 | 2.02 | 2.36 | 2.19 |
| Long Term Debt (MM) | $1,114 | $486 | $330 | $1 | $2,467 | $1,715 |
| Net Debt / EBITDA | 0.27 | -1.15 | -0.75 | -0.55 | -0.44 | -0.2 |
Advanced Micro Devices has growing revenues and increasing reinvestment in the business, low leverage, and generally positive cash flows. However, Advanced Micro Devices has slimmer gross margins than its peers, weak operating margins with a stable trend, and declining EPS growth.
A Lower P/B Ratio Than Its Sector Average but Trades Above Its Graham Number:
Advanced Micro Devices has a trailing twelve month P/E ratio of 997.0, compared to an average of 35.0 for the Technology sector. Based on its EPS guidance of $3.71, the company has a forward P/E ratio of 29.6. The company doesn't issue forward earnings guidance, and the compound average growth rate of its last 6 years of reported EPS is -20.6%. On this basis, the company's PEG ratio is -48.33, which indicates that its shares are overpriced. In contrast, the market is likely undervaluing Advanced Micro Devices in terms of its equity because its P/B ratio is 3.43 while the sector average is 7.92. The company's shares are currently trading 1463.9% above their Graham number. In conclusion, Advanced Micro Devices's impressive cash flow trend, decent P/B ratio, and reasonable use of leverage demonstrate that the company may still be fairly valued — despite its elevated earnings multiple.
There's an Analyst Consensus of Some Upside Potential for Advanced Micro Devices:
The 40 analysts following Advanced Micro Devices have set target prices ranging from $60.0 to $200.0 per share, for an average of $130.43 with a buy rating. As of April 2023, the company is trading -15.9% away from its average target price, indicating that there is an analyst consensus of some upside potential.
Advanced Micro Devices has an average amount of shares sold short because 2.5% of the company's shares are sold short. Institutions own 74.5% of the company's shares, and the insider ownership rate stands at 0.48%, suggesting a small amount of insider investors. The largest shareholder is Vanguard Group Inc, whose 9% stake in the company is worth $16,361,204,029.