We've been asking ourselves recently if the market has placed a fair valuation on Cognizant Technology Solutions. Let's dive into some of the fundamental values of this large-cap Technology company to determine if there might be an opportunity here for value-minded investors.
A Lower P/B Ratio Than Its Sector Average but Trades Above Its Graham Number:
Cognizant Technology Solutions Corporation, a professional services company, provides consulting and technology, and outsourcing services in North America, Europe, and internationally. The company belongs to the Technology sector, which has an average price to earnings (P/E) ratio of 35.0 and an average price to book (P/B) ratio of 7.92. In contrast, Cognizant Technology Solutions has a trailing 12 month P/E ratio of 17.2 and a P/B ratio of 2.74.
Cognizant Technology Solutions's PEG ratio is 3.62, which shows that the stock is probably overvalued in terms of its estimated growth. For reference, a PEG ratio near or below 1 is a potential signal that a company is undervalued.
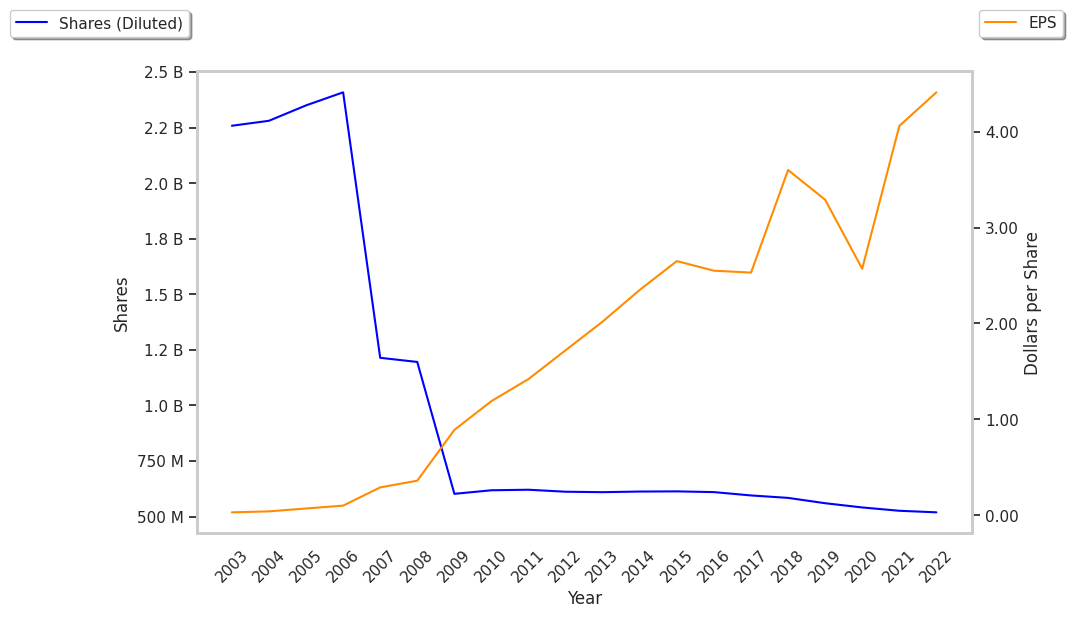
EPS Trend Sustained Primarily by Reducing the Number of Shares Outstanding:
| 2018 | 2019 | 2020 | 2021 | 2022 | 2023 | |
|---|---|---|---|---|---|---|
| Revenue (MM) | $16,125 | $16,783 | $16,652 | $18,507 | $19,428 | $19,434 |
| Revenue Growth | n/a | 4.08% | -0.78% | 11.14% | 4.98% | 0.03% |
| Gross Margins | 39% | 37% | 36% | 37% | 36% | 34% |
| Operating Margins | 17% | 15% | 13% | 15% | 16% | 14% |
| Net Margins | 13% | 11% | 8% | 12% | 12% | 11% |
| Net Income (MM) | $2,101 | $1,842 | $1,392 | $2,137 | $2,290 | $2,089 |
| Net Interest Expense (MM) | $27 | $90 | $24 | $9 | $48 | $101 |
| Depreciation & Amort. (MM) | $498 | $526 | $559 | $574 | $569 | $560 |
| Earnings Per Share | $3.6 | $3.29 | $2.57 | $4.05 | $4.41 | $4.1 |
| EPS Growth | n/a | -8.61% | -21.88% | 57.59% | 8.89% | -7.03% |
| Diluted Shares (MM) | 584 | 560 | 541 | 528 | 519 | 477 |
| Free Cash Flow (MM) | $2,215 | $2,107 | $2,901 | $2,216 | $2,236 | $1,966 |
| Capital Expenditures (MM) | $377 | $392 | $398 | $279 | $332 | $329 |
| Current Ratio | 3.18 | 2.55 | 1.94 | 2.08 | 2.17 | 2.23 |
| Long Term Debt (MM) | $736 | $700 | $663 | $626 | $638 | $614 |
| Net Debt / EBITDA | 0.0 | -0.42 | -0.51 | -0.14 | -0.27 | -0.31 |
Cognizant Technology Solutions has slimmer gross margins than its peers, weak operating margins with a stable trend, and EPS growth achieved by reducing the number of outstanding shares. On the other hand, the company benefits from growing revenues and a flat capital expenditure trend and low leverage. Furthermore, Cognizant Technology Solutions has irregular cash flows.